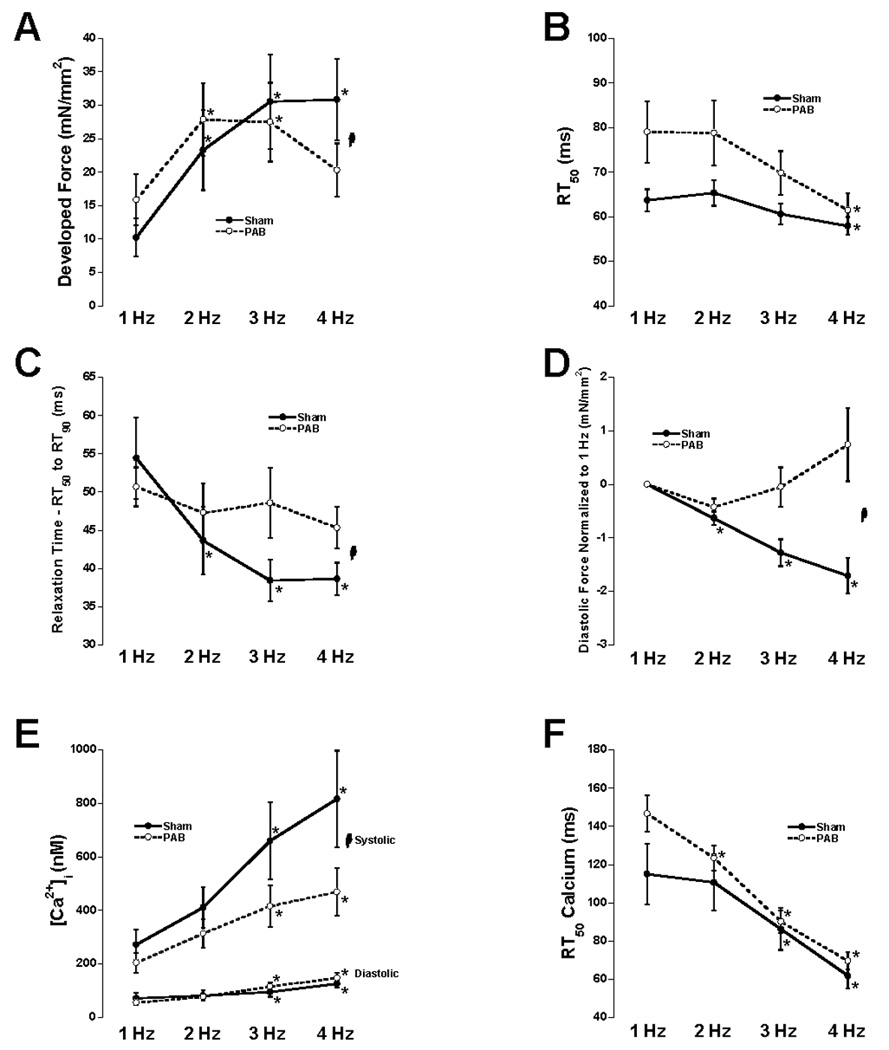
Figure 4.

Average data at all 4 frequencies of developed force (A), RT50 of force decline (B), RT50 to RT90 of force decline (C), diastolic tension relative to 1 Hz (D), diastolic and systolic calcium (E), RT50 of intracellular calcium decline (F). Two-way repeated measures ANOVA revealed a significant interaction (indicated with  ) between frequency and the two groups (indicating a difference in the relationship) with respect to developed force, RT50 to RT90, diastolic tension relative to 1 Hz, and systolic calcium. No significant interactions were found between frequency and the two groups with respect to RT50 of force decline, diastolic calcium, or RT50 of calcium decline. Analysis by each group separately by one-way ANOVA revealed a significant difference from 1 Hz in all 7 parameters measured (post-hoc t-test). * denotes significantly different compared to 1 Hz (PAB: n=11, SHAM: n=9).
