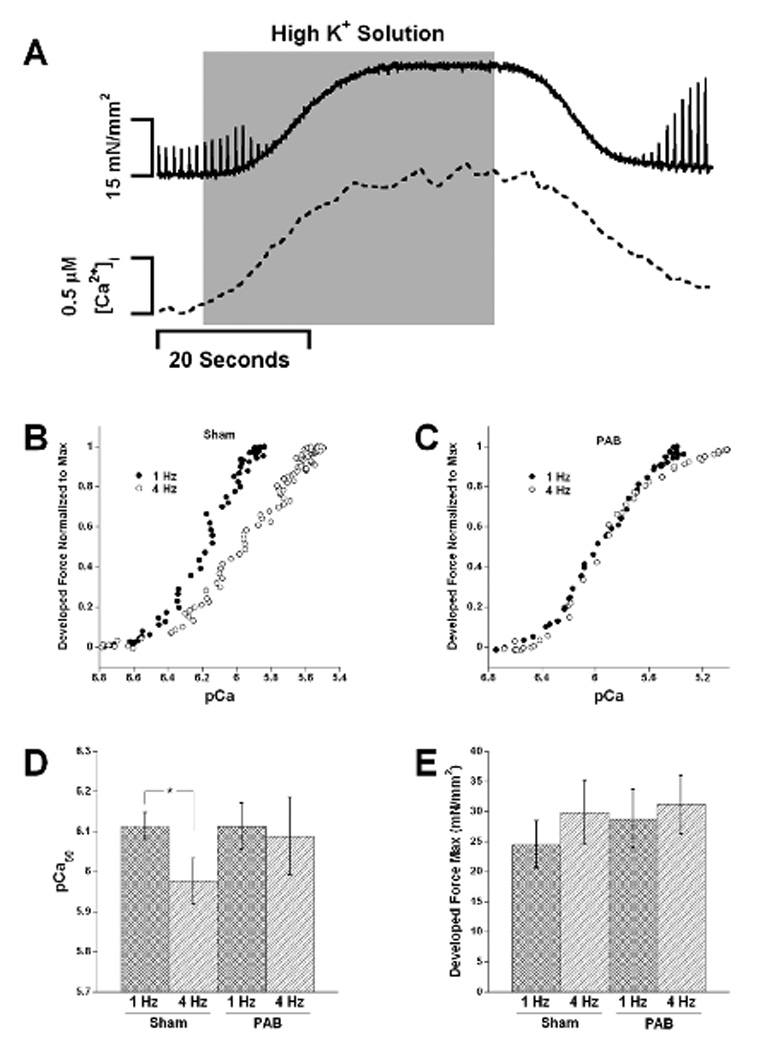
Figure 5.

Panel A shows a representative chart recording during a potassium contracture where force and calcium were measured simultaneously. Panels B and C show representative force-calcium relationships (displayed pCa and normalized to max) that were derived from the potassium contractures. We observed a shift in myofilament calcium sensitivity from 1 to 4 Hz in the sham trabeculae and observed a blunted or no shift in sensitivity in the PAB trabeculae. Panel D shows the average pCa50 for 9 sham and 11 PAB animals. The only significant change in pCa50 between frequencies was between 1 and 4 Hz in the sham trabeculae (p<0.05, Two-way repeated measures ANOVA, followed by paired t-test). Panel D shows average max force for all steady state curves at 1 and 4 Hz in sham and PAB trabeculae. No significant difference was found between any of the groups.
