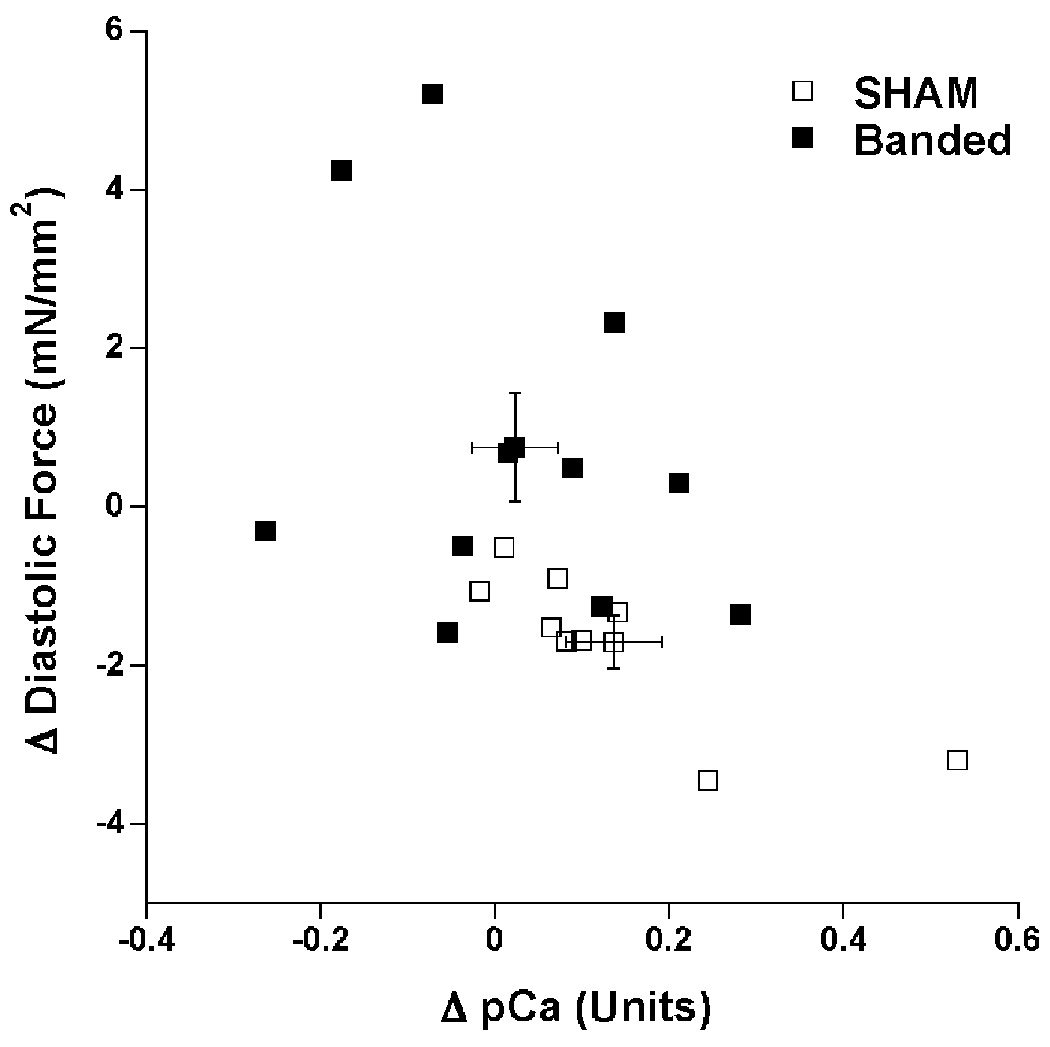
Figure 6.

Correlation of change in myofilament calcium sensitivity between 1 and 4 Hz in units of pCa with the change in diastolic tension between 1 and 4 Hz in SHAM and PAB rabbits. Error bars indicate group average values and their standard error. Both the change in diastolic tension and change in pCa were significant between the groups, PAB: n=11, vs. SHAM: n=9, P=0.01 and P=0.02 resp.).
