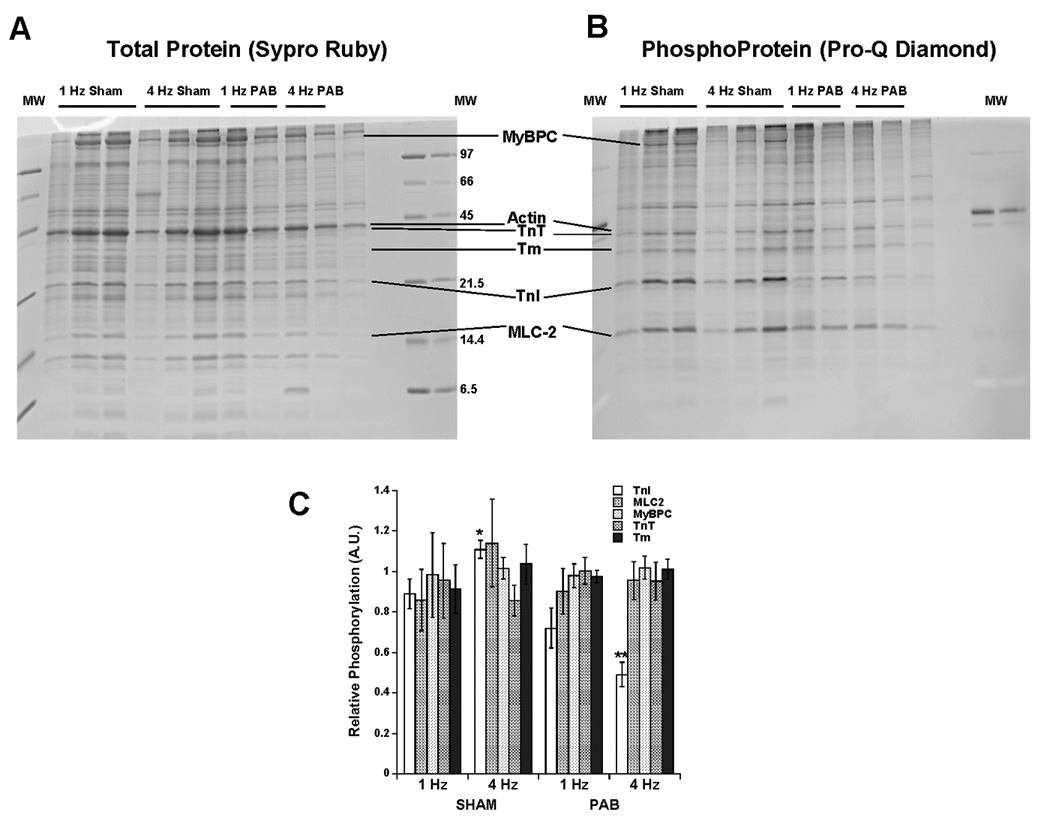
Figure 7.

An analysis of myofilament phosphorylation status in sham and PAB trabeculae at 1 and 4 Hz. Panels A and B show a gel stained for total protein (A), and subsequently phosphoprotein (B). Ratio of phosphoprotein/total protein band density is shown in panel C for Troponin-I (TnI), Myosin Light Chain-2 (MLC2), Myosin binding protein-C (MyBPC), Troponin-T (TnT), and Tropomyosin (Tm). A significant increase in TnI phosphorylation was found between 1 and 4 Hz in the sham trabeculae. (n=5–6 muscles/group, un-paired t-test).
