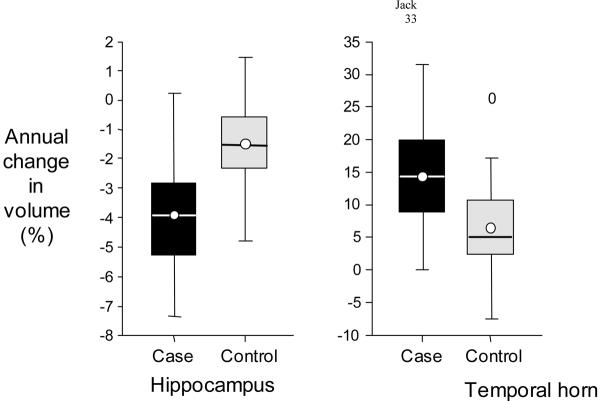
Figure 2. Annual Percent Volumetric Change.
Box plots illustrating the annual percent volumetric change of the hippocampus and temporal horn separately for cases and controls. For each group the horizontal line in the box represents the median value, the box represents the 25th and 75th percentiles, the circle represents the mean, and the vertical line represents the range of values in each group. The 0 in the temporal horn column of controls indicates the value of a lone outlier.

