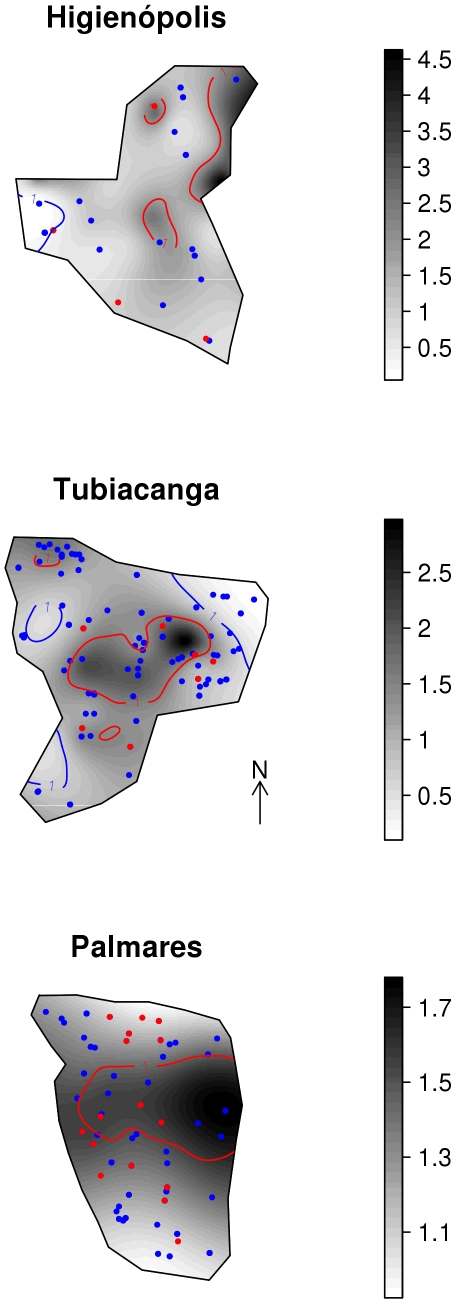
Figure 7. Map of adult Aedes aegypti distribution and recent dengue infections.
Spatial relative risk of Ae. aegypti adults density in Higienópolis (urban), Tubiacanga (suburban) and Palmares (suburban slum) neighborhoods in Rio de Janeiro, Brazil. Red dots indicate the households of individuals with recent dengue infection, blue dots individuals with no evidence of recent dengue infection.

