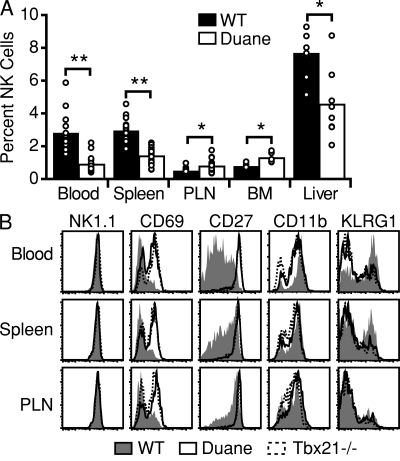
Figure 1.
Identification of the ENU mutant Duane. (A) NK cell frequencies within the indicated tissues of Duane and wild-type B6 mice. Bars represent mean values, and circles represent individual animals. Data are representative of at least two Duane and two wild-type mice in each of three independent experiments. (B) Representative flow cytometric analysis of NK cells from Duane, Tbx21−/−, and wild-type B6 mice for cell-surface markers. Plots are representative of at least three independent experiments, each analyzing at least two Duane and two wild-type mice. PLN, peripheral LN. *, P < 0.005; **, P < 0.0001.

