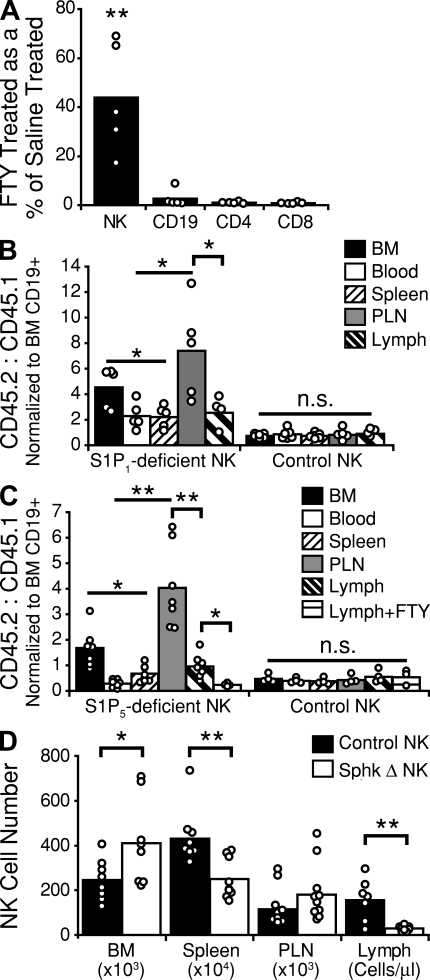
Figure 4.
NK cell egress requires S1P, and uses both S1P5 and an FTY720-sensitive receptor. (A) Cellular composition of lymph collected from wild-type mice treated for 20 h with 1 mg/kg FTY720. Values are reported as the number of cells in the lymph of FTY720-treated animals as a percentage of lymph cell numbers in saline-treated animals. Data are derived from at least three independent experiments. (B) Examination of wild-type B6 mice reconstituted with a mix of CD45.1+ wild-type and CD45.2+ S1pr1−/− or control S1pr1+/+ BM. Values are reported as a ratio of S1P1-deficient or control (CD45.2) to wild-type (CD45.1) cells. To account for differences between independent groups of chimeras, NK cell ratios were normalized to BM CD19+ B cell ratios for each mouse. Data are derived from at least three independent experiments. (C) Examination of wild-type B6 mice reconstituted with a mix of CD45.1+ wild-type and CD45.2+ S1pr5−/− or CD45.2+ S1pr5+/+ littermate control BM. Some mice (Lymph+FTY) received 1 mg/kg FTY720 i.p. 20 h before analysis. Values are reported as a ratio of S1P5-deficient or control (CD45.2) to wild-type (CD45.1) cells. NK cell ratios were normalized to BM CD19+ B cell ratios for each mouse. Data are derived from two independent experiments. (D) Analysis of NK cell distribution in Sphk-deficient and littermate control mice. Values for BM, spleen, and peripheral LNs (six nodes) represent absolute NK cell numbers; values for lymph represent cells per microliter of lymph. Sphk Δ represents mice that were Sphk2 null, were deficient for one allele of Sphk1, and had the second allele of Sphk1 excised. Control represents Sphk2-null mice with at least one functional allele of Sphk1. Data are derived from at least three independent experiments. Bars represent mean values, and circles represent individual animals. n.s., not significant; PLN, peripheral LN. *, P ≤ 0.05; **, P < 0.005.

