Figure 7.
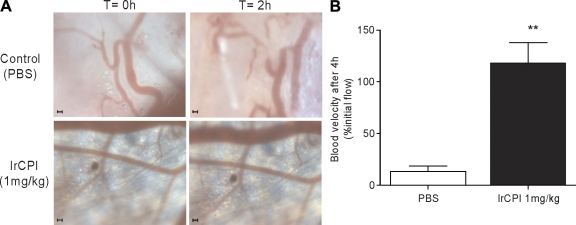
Intravital microscopy images from mouse dorsal skinfold window chambers illustrating the effect of Ir-CPI on high light intensity–induced thrombosis. (A) Representative images of microvessels of 1-mg/kg Ir-CPI–treated (bottom) and untreated (top) mice. The vessels after injection of 10 mg/kg of rose bengal but before high light intensity stimulation (time, 0) are shown on the left. The same vessels 2 h after high light intensity excitation (time, 2 h) are shown on the right. Representative images of five experiments are shown. Bars, 100 µm. (B) Bar graph showing changes in blood flow velocity in untreated and Ir-CPI–treated mice (n = 5). Results are expressed as a percentage of initial flow measured in each vessel. Data represent the mean ± SEM of results obtained from five independent experiments. **, P < 0.01.

