Figure 1.
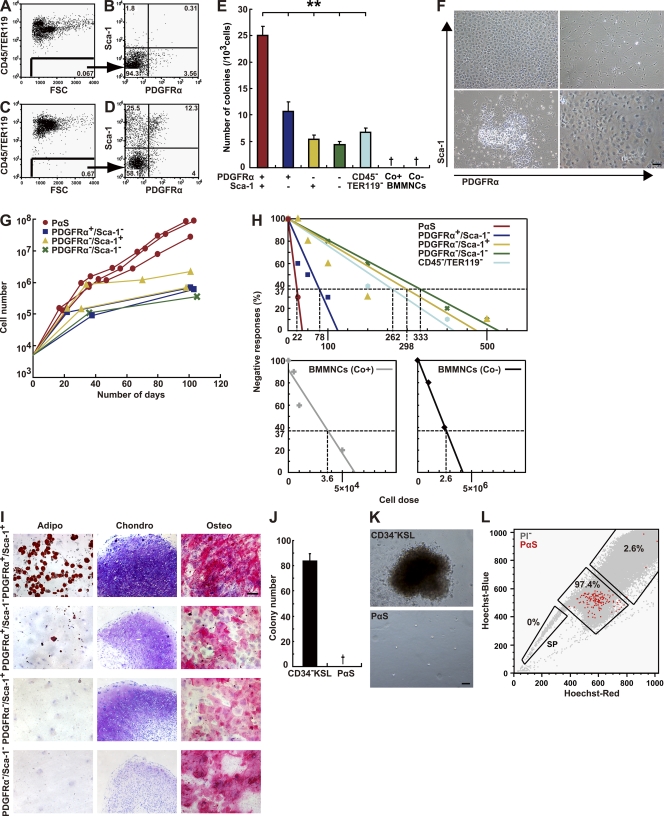
Enrichment of mesenchymal stem cells in the PαS population. (A–D) Representative flow cytometric profiles of BM mononuclear cells stained with CD45, TER119, PDGFRα, and Sca-1 without (A and B) or with (C and D) collagenase treatment. (E) Number of CFU-Fs 14 d after plating. Data are mean ± SEM (n = 3 per group; **, P < 0.01; †, no colonies observed). (F) Phase-contrast micrographs of CFU-Fs 14 d after plating, derived from 5,000 PDGFRα−Sca-1+, PDGFRα+Sca-1+, PDGFRα+Sca1−, or 1 × 10⁴ PDGFRα-Sca-1− cells. (G) Growth curves of representative populations derived from 5,000 cells plated. (H) Negative linear relationship between the number of subpopulation BM cells seeded and the proportion of negative colony formation obtained by three independent experiments. (I) Adipogenesis (left) was indicated by neutral lipid vacuoles that stained with oil red O on day 14. Chondrogenesis (middle) indicated by toluidine blue staining on day 21 and by morphological changes. Osteogenesis (right) indicated by alkaline phosphatase staining on day 14. (J) CFU-Cs assays. PαS cells (5,000) and CD34− KSL cells (100) were seeded into separate cultures with MethoCult medium. The total numbers of colonies counted at 14 d are shown. †, no colonies observed. (K) Phase-contrast micrograph of a representative colony derived from CD34− KSL cells (top). No colonies arose from PαS cells under this condition (bottom). Bars, (F, I, and K) 100 µm. (L) Two-dimensional flow cytometric profile of the Hoechst-Red and Hoechst-Blue fluorescence intensity of PI-negative cells (gray) and PαS cells (red). Data are representative of three independent experiments.

