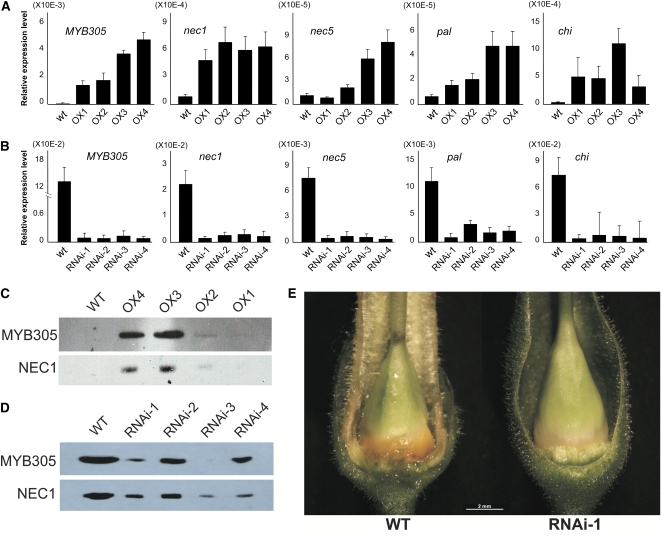
Figure 9.
Analysis of LxS-MYB305 Overexpression and RNAi Plants.
(A) Quantitative RT-PCR analysis of LxS-myb305, nec1, nec5, pal, and chi expression in the foliage of LxS-MYB305 overexpression N. tabacum plants. Means + sd are shown (four biological replicates with two technical replicates each).
(B) Quantitative RT-PCR analysis of LxS-myb305, nec1, nec5, pal, and chi expression in the stage 12 nectary glands of LxS-MYB305 RNAi N. tabacum plants. Means + sd are shown (four biological replicates with two technical replicates each).
(C) Immunoblotting of MYB305 and NEC1 proteins in the foliage of LxS-MYB305 overexpression N. tabacum plants. Film exposure time was 1 h for MYB305 and 12 h for NEC1.
(D) Immunoblotting of MYB305 and NEC1 proteins in the stage 12 nectary glands of LxS-MYB305 RNAi N. tabacum plants. Film exposure for both MYB305 and NEC1 was 30 min.
(E) Phenotype comparison of wild-type N. tabacum nectary and RNAi N. tabacum nectary. Bar = 2 mm.

