Figure 3.
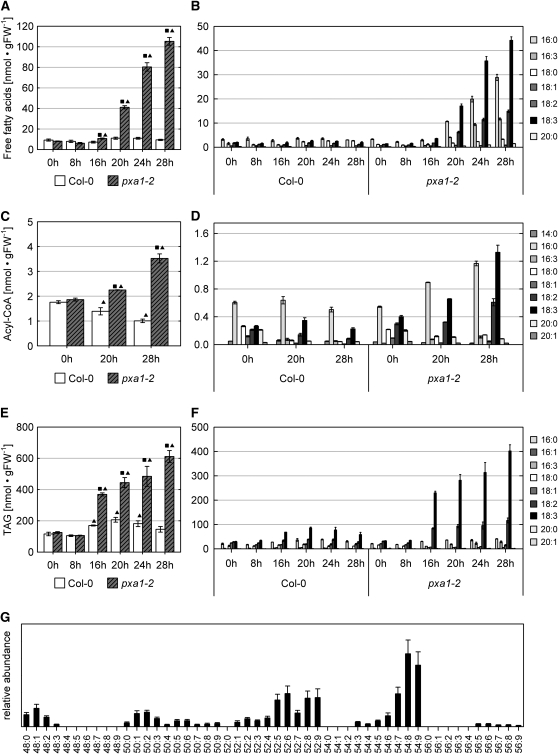
Effects of Prolonged Dark Treatment on Fatty Acid Metabolism of pxa1 Plants.
Lipids were extracted from leaves of 21-d-old plants pregrown in a 16/8-h (day/night) cycle and exposed to darkness for the time indicated. Plants were harvested at the end of the dark treatment without reexposure to light. The values present the mean of at least three biological replicates, and error bars indicate se. Square: Significantly different values between wild-type and pxa1-2 plants at the same incubation time (P ≤ 0.05). Triangle: Significantly different within one genotype between the incubation time indicated and time 0 h (P ≤ 0.05). Data in (A) to (F) are given in nmol/gram of fresh weight [nmol • gFW−1].
(A) Total free fatty acid concentrations in leaves of pxa1 and Col-0 plants exposed to extended dark treatment.
(B) Free fatty acid profile in leaves of pxa1 and Col-0 plants.
(C) Acyl-CoA pool of pxa1 and wild-type leaves.
(D) Acyl-CoA profiles of pxa1 and wild-type leaves.
(E) Quantification of TAG in leaves of pxa1 and Col-0 plants.
(F) Fatty acid profiles of TAG. TAG was recovered from TLC plates and subjected to transmethylation prior to analysis by gas chromatography.
(G) Molecular species of triacylglycerol extracted from pxa1-2 leaves exposed to 20 h of darkness. The sum of the acyl groups are symbolized by the convention, carbon number:number of double bounds. As shown in (F), the fatty acid composition of the TAGs is based almost exclusively on C16 and C18 fatty acids. Therefore, 54:6, for example, indicates a TAG containing two C18 fatty acids and one C16 fatty acid with altogether six double bonds.

