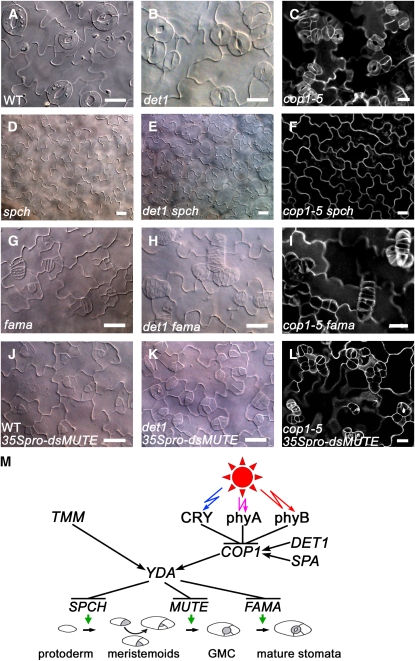
Figure 9.
Genetic Interactions of COP1 and DET1 with SPCH, MUTE, and FAMA.
(A) to (L) Abaxial cotyledon epidermis of 10-d-old white-light (150 μmol·m−2·s−1)-grown wild type (A), det1 (B), cop1-5 (C), spch (D), det1 spch (E), cop1-5 spch (F), fama (G), det1 fama (H), cop1-5 fama (I), WT 35Spro–dsMUTE (J), det1 35Spro–dsMUTE (K), and cop1-5 35Spro–dsMUTE (L). The images in (C), (F), (I), and (L) are PI (white)-outlined photomicrographs, and the others are DIC photomicrographs. Bars = 20 μm.
(M) A genetic model for the light signaling pathway and its interaction with the developmental pathway. COP1 activity is negatively regulated by CRY, phyA, and phyB but is positively regulated by SPA and DET1, presumably through physical interactions (Wang et al., 2001; Yang et al., 2001; Seo et al., 2003; Yanagawa et al., 2004). YDA might be positively regulated by COP1 through yet unknown mechanisms. Arrow, positive regulation; T-bar, negative regulation. GMC, guard mother cell.

