Figure 2.
Localization of Lsi6 Protein in Node I.
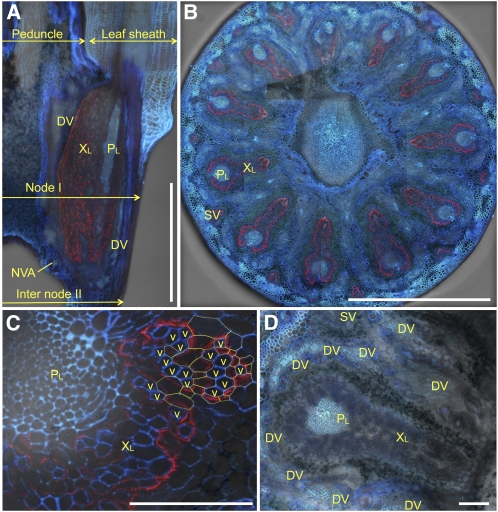
Immunostaining of Lsi6 (red) and cell wall UV autofluorescence (blue and cyan) in node I of the wild type ([A] to [C]) and a Lsi6 T-DNA insertion line (D). Xylem and phloem region of large vascular bundles (XL and PL), small vascular bundle (SV), diffuse vascular bundle (DV), and nodal vascular anastomoses (NVA) are shown. Bars = 1 mm in (A) and (B) and 100 μm in (C) and (D).
(A) Longitudinal section of node I.
(B) Cross section at the center of node I.
(C) Enlarged image of cross section of a large vascular bundle. Outlines of some xylem transfer cells are highlighted by yellow broken lines, and the adjacent xylem vessels (v) are indicated.
(D) Xylem and phloem region of large vascular bundles and diffuse vascular bundles in a cross section of the T-DNA line.

