Figure 3.
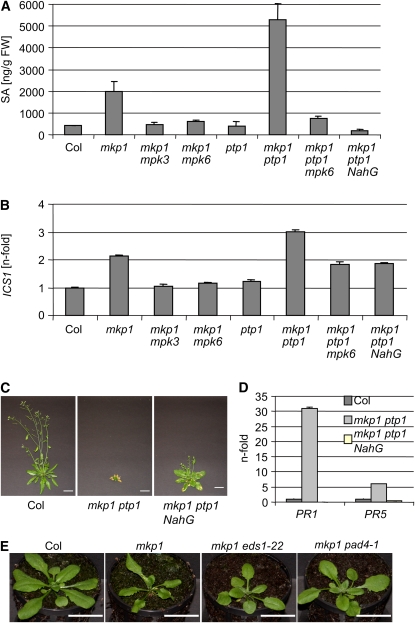
SA Accumulation Is Largely Responsible for the Aberrant mkp1(Col) and mkp1 ptp1 Phenotypes.
(A) Total SA levels of 22-d-old soil-grown plants, as determined by HPLC. The average of three independent biological samples is shown for each genotype. Error bars represent sd.
(B) Quantitative RT-PCR analysis of ICS1 expression levels. Representative data of three biological replicates are shown. Error bars represent sd of the technical triplicates.
(C) Photographs of 40-d-old soil-grown plants showing that expression of NahG largely suppresses the mkp1 ptp1 growth phenotype (note that the Col and mkp1 ptp1 photographs are identical to those shown in Figure 2A; all photographs were taken in parallel, under identical conditions). Bars = 2 cm.
(D) Quantitative RT-PCR analysis of PR1 and PR5 expression levels in 22-d-old mkp1 ptp1 and mkp1 ptp1 NahG compared with wild-type Col. Representative data of three biological replicates are shown. Error bars represent the sd of the technical triplicates.
(E) Photographs of 22-d-old plants grown on soil under standard conditions showing that eds1 and pad4 mutations suppress the mkp1 growth phenotype. Bars = 2 cm.
[See online article for color version of this figure.]

