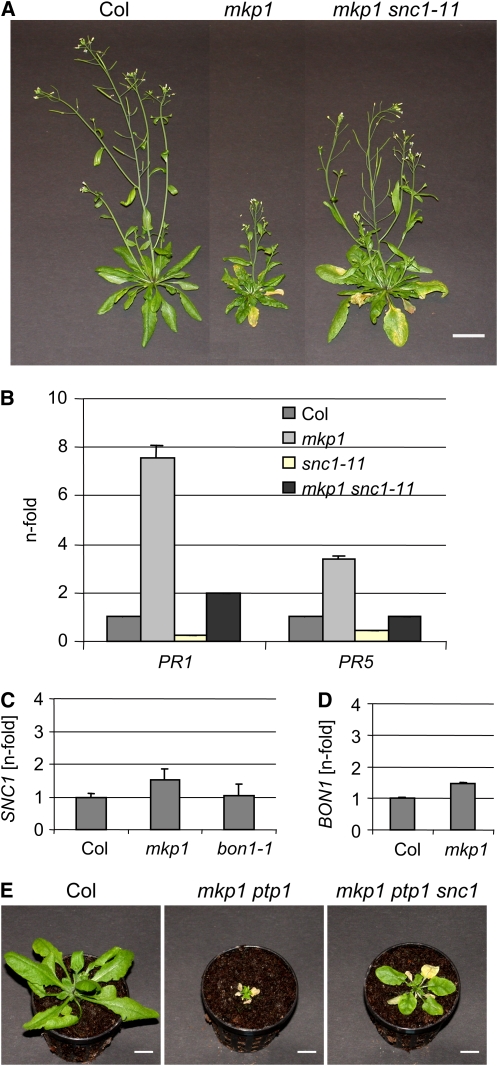
Figure 5.
SNC1 Is a Natural Modifier of mkp1.
(A) Photographs of 40-d-old soil-grown plants showing that snc1 largely suppresses the mkp1 growth phenotype (note that the Col and mkp1 photographs are identical to those shown in Figure 2A; all photographs were taken in parallel, under identical conditions). Bars = 2 cm.
(B) to (D) Quantitative RT-PCR analysis of PR1 and PR5 (B), BON1 (C), and SNC1 (D) gene expression. Representative data of three independent experiments are shown. Error bars represent the sd of the technical triplicates.
(E) Photographs of 34-d-old soil-grown plants showing that snc1 partially suppresses the mkp1 ptp1 growth phenotype. Bars = 1 cm.
[See online article for color version of this figure.]

