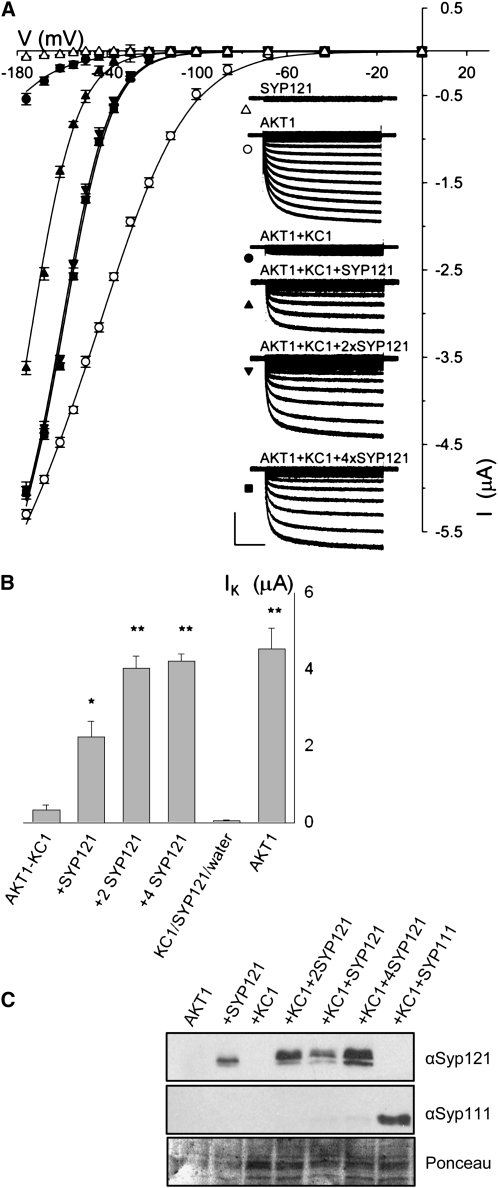
Figure 3.
Coexpression with SYP121 Selectively Rescues AKT1-KC1 K+ Current in Xenopus Oocytes.
(A) Current traces and steady state current voltage curves recorded under voltage clamp in 96 mM K+ from oocytes expressing SYP121 alone (triangles), AKT1 alone (open circles), AKT1 with KC1 (closed circles∂, molar ratio 1:1), and AKT1 with KC1 and SYP121 (SYP121:KC1 cRNA molar ratios: 1:1, upright triangle; 2:1, downward triangle; 4:1, square). Clamp cycles: holding voltage, −50 mV; voltage steps, 0 to −180 mV. Insets: Corresponding whole-cell currents cross-referenced by symbol. Scale: 2 μA and 1 s. Currents from oocytes injected with water and with KC1 cRNA only gave results similar to those for SYP121, and currents from oocytes injected with cRNAs for AKT1 together with KC1 and SYP111 or SYP122 were indistinguishable from those injected with cRNAs for AKT1 plus KC1 alone. Currents from oocytes injected with cRNAs for AKT1 and SYP121 showed gating characteristics similar to those for AKT1 alone and expressing KC1 alone or with SYP121 failed to yield a measureable current (data not shown). All measurements performed as coexpressions with CBL1 and CIPK23 essential for AKT1 function in oocytes in 1:1:1 molar ratios with AKT1 (Xu et al., 2006), and no current was observed in the absence of CBL1/CIPK23 expression (data not shown). Final cRNA volume for each oocyte was equal. Similar results were obtained with the same construct combinations when expressed in Sf9 insect cells (see Supplemental Figure 3 online) without the additional expression load of CBL1/CIPK23. Solid curves are the results of joint, nonlinear least squares fitting of the K+ currents (IK) to a Boltzmann function IK = gmax(V − EK)/(1 + eδ(V−V1/2)/RT), where gmax is the conductance maximum, and V, EK, R, and T have their usual meanings. The characteristic voltage dependence (V1/2) indicates the midpoint of the voltage range for gating, and the apparent gating charge (δ) is an unique property of the gate, its sensitivity to voltage changes and the associated conformations. Best fittings were obtained with gmax held in common and with separate, joint values for δ with and without SYP121 expression. Similar results were obtained in each of eight separate analyses. (see Table 1).
(B) Summary of K+ current amplitudes recorded from oocytes expressing AKT with KC1 in combinations with SYP121 (cRNA injection ratios indicated) and expressing AKT1 alone. Data are means ±se obtained at -160 mV from >9 independent measurements in each case (significant difference from AKT1+KC1 ** at P < 0.01 and * at P < 0.05).
(C) Verification of SNARE protein expression in oocytes. Oocytes were injected with AKT1, CIPK23, CBL1 cRNA (AKT1, molar ratios 1:1:1), and with SYP121 (+SYP121, molar ratios 1:1:1:1), KC1 (+KC1, molar ratios 1:1:1:1), KC1 and Syp121 (+KC1+SYP121, molar ratios 1:1:1:1:1; +KC1+2SYP121, molar ratios 1:1:1:1:2; +KC1+4SYP121, molar ratios 1:1:1:1:4), and KC1 and SYP111 (+KC1+SYP111, molar ratios 1:1:1:1:1). Protein gel blot analysis of total membrane protein extracted from oocytes collected after electrical recordings detected with antibodies specific to SYP121 and SYP111. Ponceau S stain was used to normalize SYP121 expression levels for lanes with KC1 and yielded ratios of 1: 2.04:3.4.

