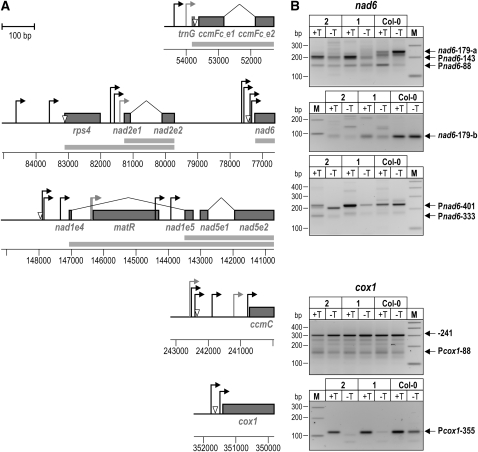
Figure 6.
Analysis of TSSs in rpoTmp and Wild-Type Seedlings.
(A) Maps of mtDNA regions for which TSSs and transcript 5′ end processing sites were analyzed. Protein-coding sequences are displayed as gray boxes and labeled with the corresponding gene names. In the case of cis- and trans-spliced sequences, exons are labeled with the gene name, followed by the letter e and the exon number. Splicing events are indicated by a bent line between exons. TSSs mapped in 5′-RACE analyses are indicated by bent arrows; open triangles mark 5′ end processing sites. Putative promoters, for which primary 5′ termini could not be experimentally distinguished, are drawn in gray. Where indicated by experimental results, cotranscription of genes and exons is shown by gray bars below gene maps. Coordinates of the analyzed regions on the mtDNA are indicated.
(B) 5′-RACE analysis of nad6 and cox1 transcripts. 5′-RACE was performed on RNA extracted from 7-d-old rpoTmp-1 (lanes labeled 1), rpoTmp-2 (2), and wild-type (Col-0) seedlings using a 5′-RACE technique that exploits the difference in 5′ end phosphorylation between primary and processed transcript 5′ ends (Bensing et al., 1996). Products obtained from TAP-treated (+T) and untreated RNA (−T) were separated on agarose gels alongside a molecular weight marker (M). Products from primary transcript 5′ ends are labeled with the name of the corresponding promoter as listed in Table 1; products corresponding to processed ends are labeled accordingly. The product from the processed end nad6-179 was barely detectable in rpoTmp-1 and -2 (signal marked nad6-179-a) but could be amplified with a reverse primer not detecting any downstream 5′ ends (nad6-179-b).

