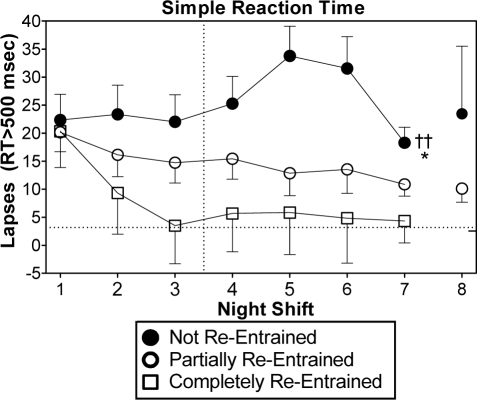
Figure 2.
Lapses (reaction time > 500 milliseconds) during the 6:30 test bout of the simple reaction time task. The vertical line between night shifts 3 and 4 indicates that these shifts were separated by 2 days off. Scores are difference-from-baseline. The dotted horizontal lines indicate the baseline mean for all subjects. Symbols denoting statistical significance next to night shift 7 indicate a main effect of group during night shifts 1-7. †† indicates a difference (P < 0.01) between the not re-entrained and completely re-entrained groups. * indicates a difference (P < 0.05) between the not re-entrained and partially re-entrained groups. The tick mark on the right y-axis indicates average baseline scores during the last test bout at the end of the day shifts (16:30). Error bars show SEM. The other ANAM tasks showed a similar progression across night shifts.

