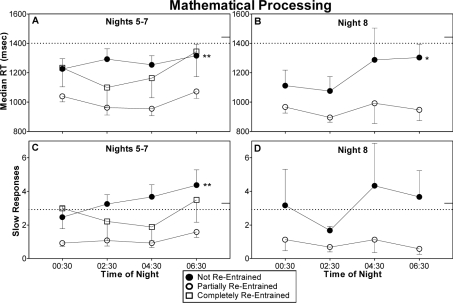
Figure 4.
Median reaction time (top) and slow responses (bottom) on the mathematical processing task. Remaining aspects of figure as for Fig 2. Statistical symbols in panels A, B, and C denote a significant main effect of group. *(P < 0.05) and **(P < 0.01) indicate differences between the not re-entrained and partially re-entrained groups.

