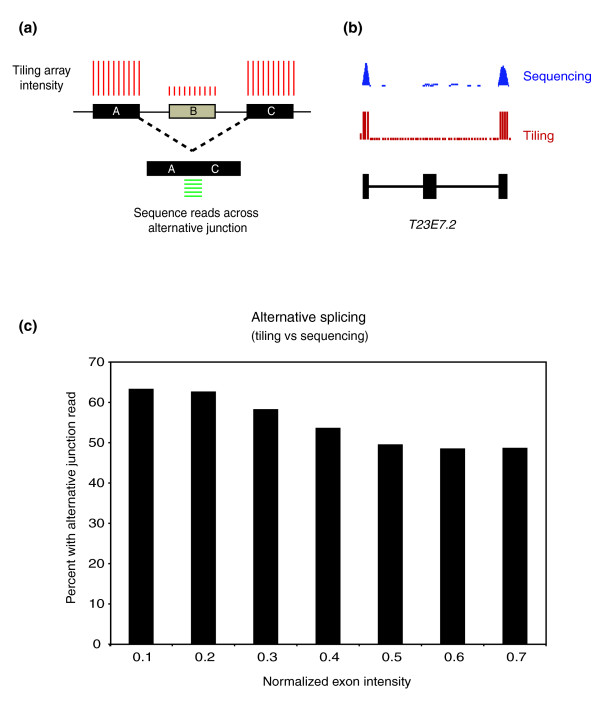
Figure 3.
Splicing changes. Normalized exon intensities (see Materials and methods) were calculated for all exons. (a) The set of cassette exons was determined using our tiling data as exons with an NI <0.8 (exon B). Cassette exons may also be indicated by the presence of sequence reads spanning the boundaries of the flanking exons (exons A and C). (b) An example of a typical cassette exon. (c) Exons were binned based on their NI (x-axis) and the percentage of these cassette exons that have sequence reads spanning the exonA-exonC junction were identified. At a NI <0.2 nearly 65% of the cassette events show an alternative exon read while 50% of all exons with NI <0.5 can be shown to have an alternative junction spanning read.

