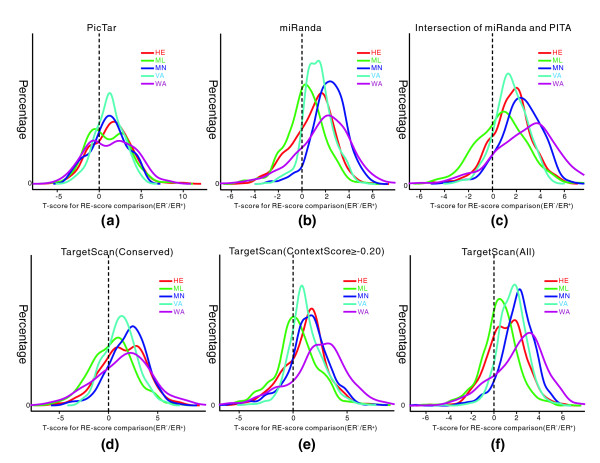
Figure 3.
Distributions of the t-scores for comparison of RE-scores based on distinct miRNA target prediction algorithms. (a) PicTar algorithm. (b) miRanda algorithm. (c) Intersection of miRanda and PITA. (d-f) TargetScan algorithm where the site is conserved (d), the site context score is above -0.20 (e), and all potential targets are included (f). The t-score distributions for the five datasets are shown in different colors. The t-scores are more likely to be positive values in all five datasets, suggesting that miRNAs have stronger inhibitory effects on their targets in ER- breast cancer.

