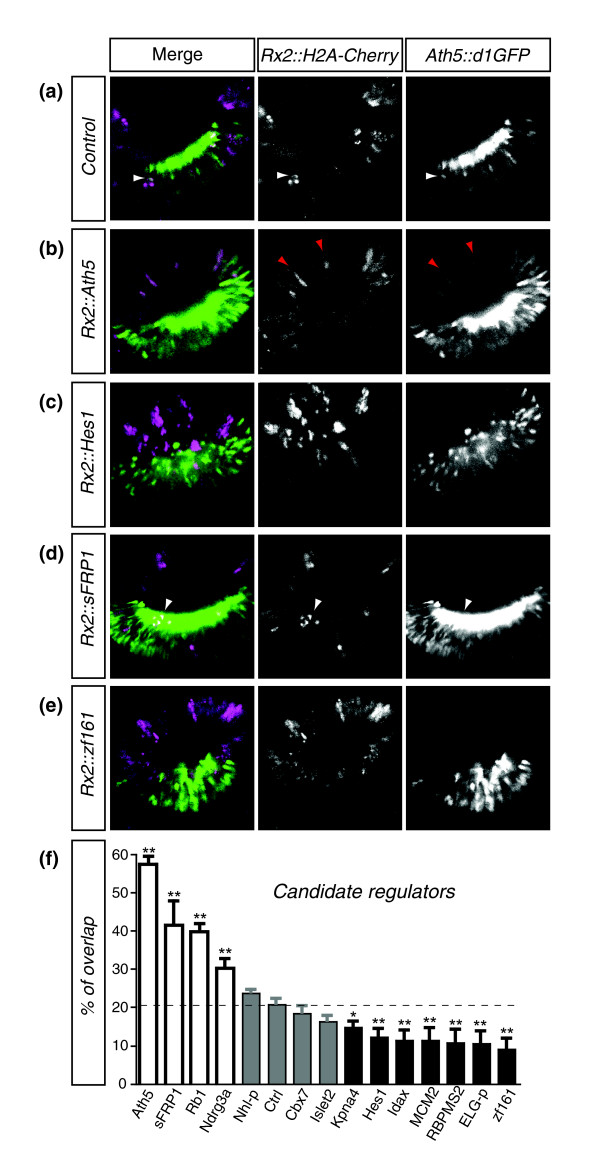
Figure 5.
Targeted overexpression analysis. (a-e) Reporter expression. Optical confocal sections through stage 26 retina of Ath5::d1GFP transgenic medaka at the level of the lens. Embryos were co-injected with Rx2::candidate and Rx2::nuclearCherry at the one-cell stage. White arrowheads indicate representative double-labeled cells. Red arrowheads indicate the ectopic differentiation of Ath5-positive neurons in the peripheral retina upon Ath5 over-expression (f) Analysis of reporter overlap. For each candidate the percentage of overlap between the regulator and Ath5-positive cells is plotted, with error bars indicating the standard error. The significance of the differences was explored by one-way Anova analysis followed by Dunnett's post-tests to compare each value with the control. Values significantly higher (P < 0.01) than the control are shown by white bars, and percentages significantly lower by black bars. Percentages that deviate non-significantly from the control are shown by grey bars.

