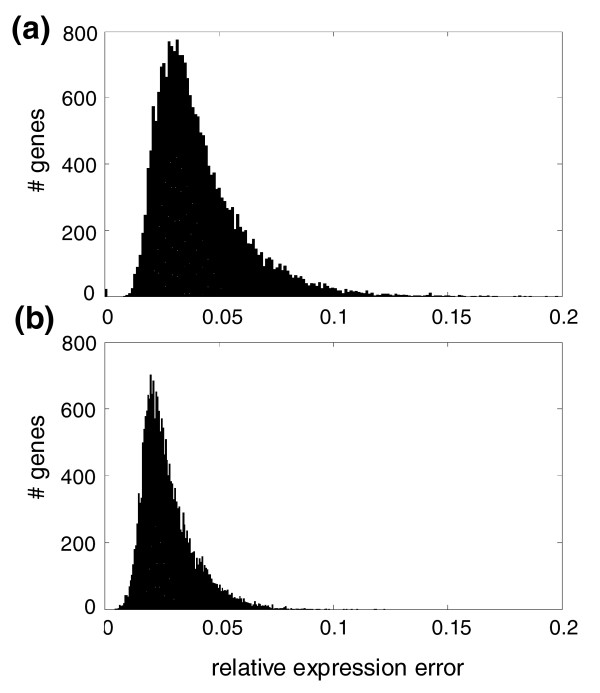
Figure 4.
Histogram of the relative gene expression error in (a) the transcriptional test model (with an average error of 0.0402) and (b) the effective model (with an average error of 0.0280). Errors were obtained from the comparison of the predicted model obtained from the training dataset and the experimental determinations contained in the random test dataset.

