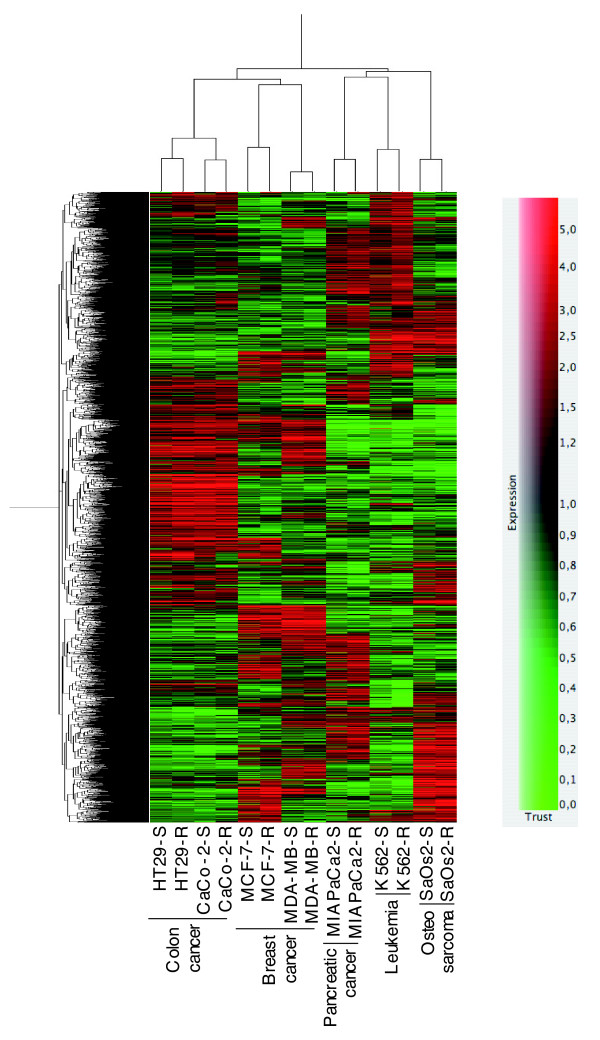
Figure 1.
Heat map of differentially expressed genes. Lists of differentially expressed genes with a t-test P-value < 0.05 including multiple testing correction were generated for each cell line. A hierarchical clustering method in GeneSpring GX v 7.3.1 was used to construct both the gene tree and the sample tree, as described in Methods. Data are shown in a matrix format: each row represents a single gene, and each column represents a cell line. Red indicates overexpressed genes (expression levels over the median) and green indicates underexpressed genes (expression levels under the median; see legend). The pattern and length of the branches in the dendrograms reflect the relatedness of the samples or the genes.

