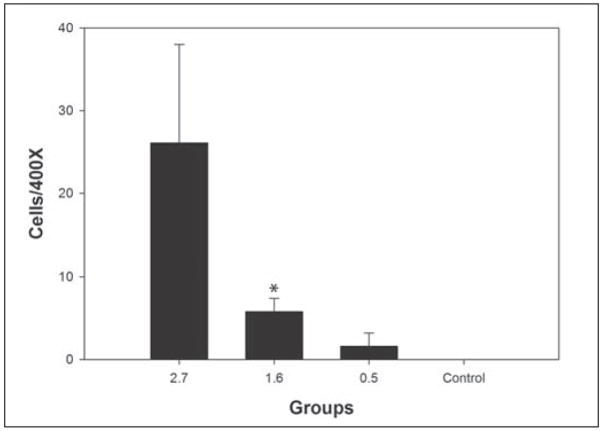
Figure 4.
Graph of CD11b results for the three femtosecond laser groups and the unwounded control. * indicates a significant difference compared to the unwounded control. The result in the high energy group did not reach significance due to high variability in inflammatory cell infiltration in that group.

