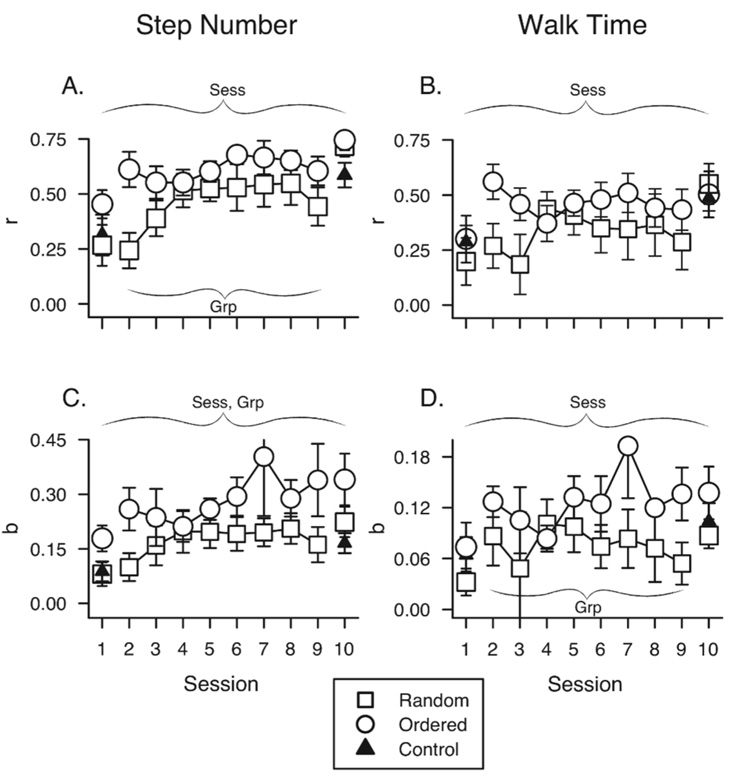
Figure 4.
Average data for each group at every session on all slopes. Open circles represent the ordered trial group. Open squares represent the random trial group. Filled triangles represent the control group. (A) Correlations (r) between slope angle and step number and (B) between slope angle and walk time. (C) Regression coefficients (b) for step number and (D) walk time. Data at session 10 reflect the increase in infants’ average walking thresholds from session 1 (M = 21.68°) to session 10 (M = 27.52°). Error bars depict standard errors.

