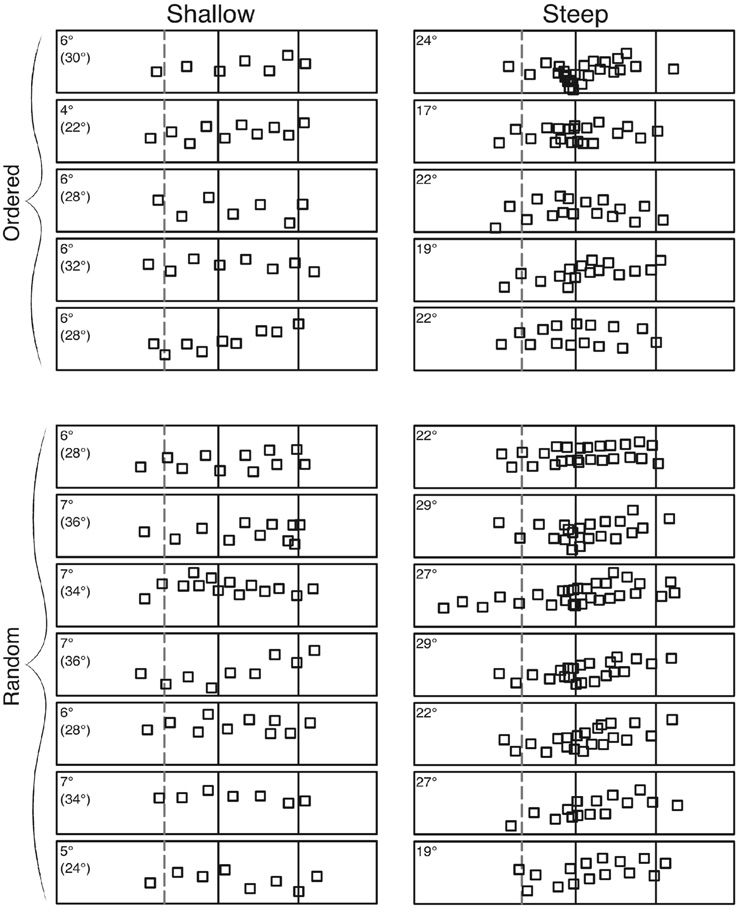
Figure 6.
Footprint data on one shallow (20% of session 10 threshold) and one steep (80% of session 10 threshold) for each infant in the two practice groups. Each graph represents an overhead view of the sloping walkway. Solid vertical lines demarcate portions of the walkway. The leftmost portion represents the flat starting platform. The middle section represents the slope. The rightmost portion represents the flat landing platform. Therefore, the direction of infants’ walking progressed from left to right. The dashed gray line depicts the portion of the starting platform that is 24 inches away from the brink of the slope. Each row represents data for one infant and each symbol represents a step. Infants in the ordered trial group are shown on the top half of the page (one infant did not contribute data). Infants in the random trial group are shown on the bottom of the page. Numbers in the top left corner of the graphs indicate the shallow and steep slope angles. Degrees were rounded to the nearest whole number after shallow and steep slope angles were calculated. Note that the fourth infant in the ordered trial group walked on a steep slope angle at 60% of the threshold due to a refusal at the steep 80% threshold slope angle. Numbers in parentheses show each infant’s walking threshold at session 10.

