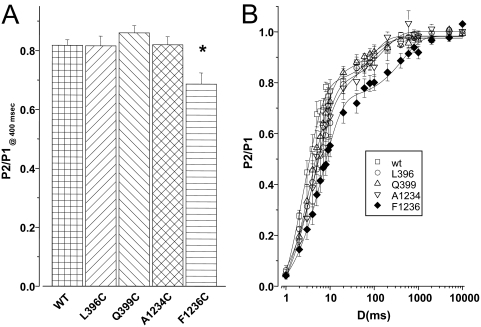
Fig. 6.
Entry into and recovery from slow inactivated states. A, conditioning pulses of 3 to 1000 ms to −20 mV (P1) were used to promote entry into slow inactivated states. The rate of entry was assessed by a 50-ms test pulse to −20 mV after 20 ms at −100 mV to permit recovery from fast inactivation from a holding potential of −100 mV (P2) after the conditioning pulse. The P2/P1 ratio after a conditioning pulse duration of 400 ms is plotted. The rate of entry into slow-inactivated states was not changed in any of the mutants except F1236C (*, p < 0.05). B, recovery from inactivation after a 500-ms test pulse to −20 mV (P1) was assessed by a second test pulse to −20 mV (P2) after varying intervals at −100 mV. Recovery from inactivation was uniquely slowed in F1236C.

