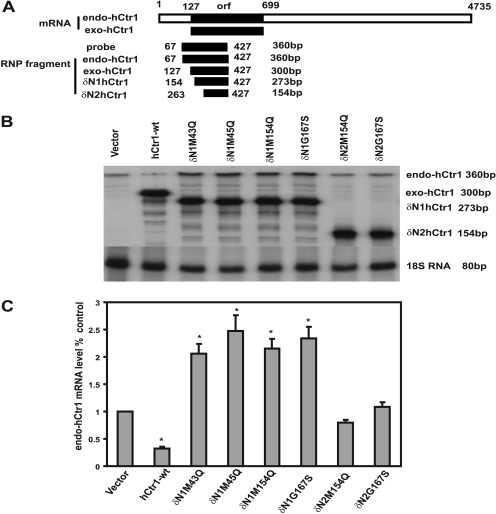
Fig. 6.
Expression levels of endogenous hCtr1 mRNA in the N-terminal deletion mutant hCtr1-transfected cells. A, schematic diagram showing the sizes of endo-hCtr1 mRNA, exo-hCtr1 mRNA, the probe used, and the anticipated protected fragment by the RNase protection assay. B, autoradiograph of RNase protection assays. C, densitometric analyses of the autoradiograph shown in B. Details are the same as described in the legend to Fig. 3.

