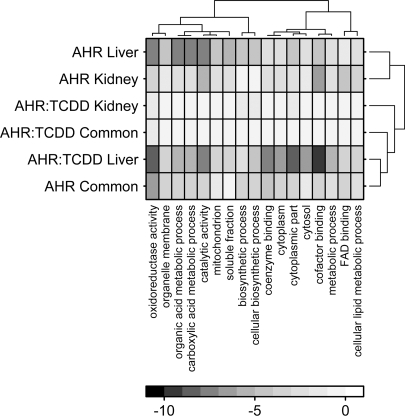
FIG. 5.
Functional analysis of perturbed genes. GO enrichment analysis was performed on the sets of genes altered in response to Ahr genotype or TCDD exposure in kidney only, liver only, or both tissues. The log10(p values) were calculated for each GO term and the 17 terms with pcumulative < 10−12 are shown here. Unsupervised hierarchical clustering was used to determine relationships amongst GO terms and tissues. The color-bar indicates log10(p values), so dark squares indicate highly statistically significant enrichments.

