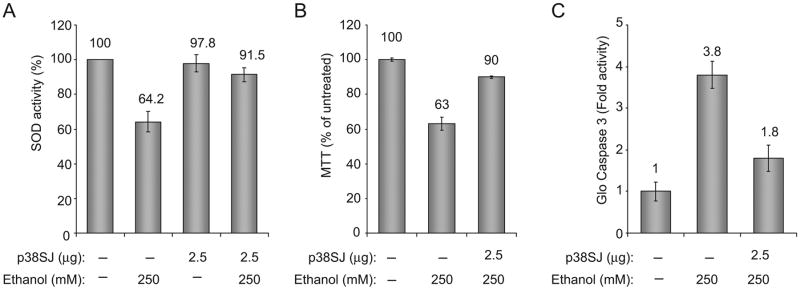
Figure 3. Oxidative stress, cell viability, and caspase-3 assays.
(A) Neuronal cells treated with ethanol for 24 h or pretreated with p38SJ for 2 h prior to exposure to ethanol. Cells were analyzed by SOD assay. SOD activity is shown as % of untreated control (bar 1).(B)Cell viability determined by MTT assay.(C)Caspase-3 activity determined by Caspase-3/7 assay.

