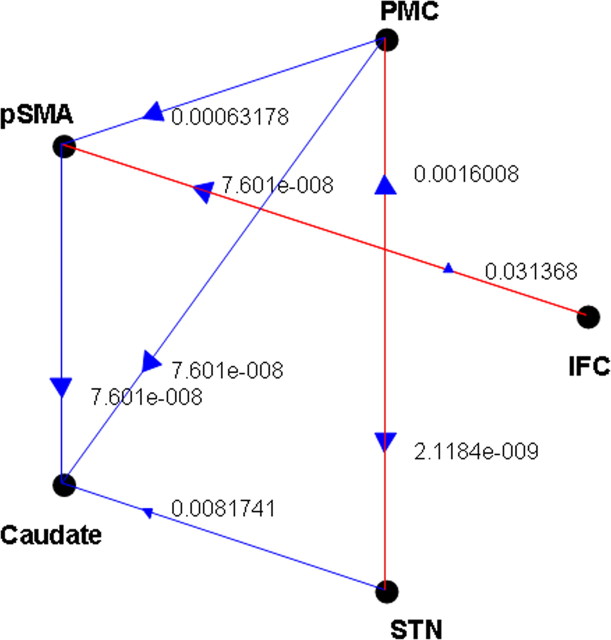
Figure 2.
The results of G-causality analysis with significance of individual connectivity tested against bootstrapped surrogate time series. p values are obtained from binomial test. Overall, the pattern of G-causality was almost identical to that shown in Figure 1.

