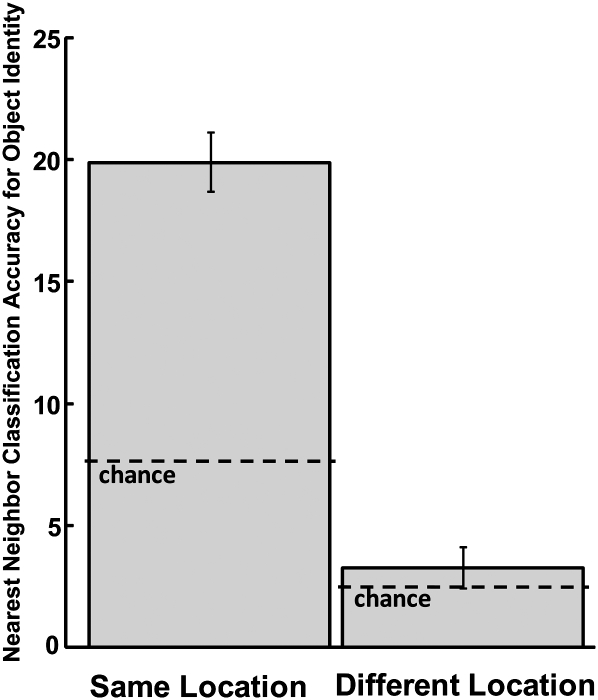
Figure 5.
Nearest neighbor classification accuracy for object identity. Accuracy is shown as the percentage of object encounters for which the multivariate data point was closest to the data point of another encounter with the same object. The left bar shows the accuracy when considering only objects in the same location. The right bar shows the accuracy when considering only objects encountered in a different location. The accuracy for objects in the same location was well above chance (indicated by a dashed line) but was not significantly above chance for objects in different locations (see Results). Error bars, SEM for the four rats.

