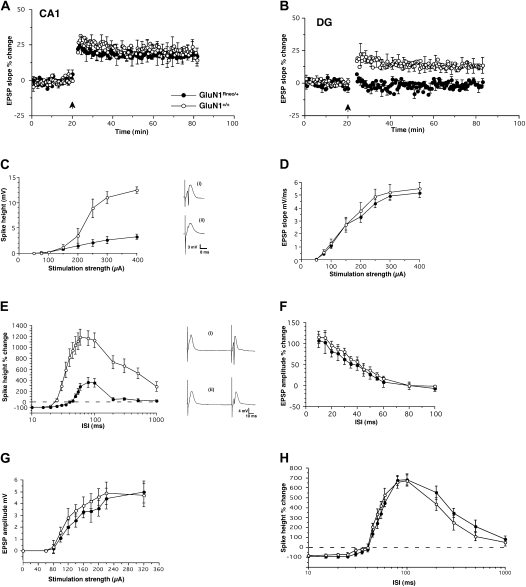
Figure 2.
Altered electrophysiological properties in the hippocampus of GluN1Rneo/+ mice, in vivo. (A) Unaltered LTP in area CA1 after tetanic stimulation (n = 5, each genotype; ●, GluN1Rneo/+; ○, GluN1+/+). (B) Absence of LTP in the DG in GluN1Rneo/+ animals (n = 9) after tetanic stimulation of the perforant path, in contrast to wild-type GluN1+/+ (n = 8). (C) Stimulus-response curves for the population spike in the DG. Note strongly reduced population spike amplitude of GluN1Rneo/+ animals compared with GluN1+/+ wild-type mice (n = 7, each). Insets: Representative EPSP traces are included on the right (i) GluN1+/+ and (ii) GluN1Rneo/+; scales: 8 msec, 3 mV. (D) Stimulus-response curves for field EPSP in the DG are similar in GluN1Rneo/+ and GluN1+/+ (n = 7, each). (E) DG paired-pulse interaction. Note prolonged paired-pulse inhibition of population spike at short intervals and reduced facilitation at long intervals in GluN1Rneo/+ animals compared with GluN1+/+ wild-type mice, measured as percent change of the population spike height (n = 10, each). ISI corresponds to interstimulus interval. Representative traces are included on the right (i) GluN1+/+ and (ii) GluN1Rneo/+; scales: 10 msec, 4 mV. (F) Subthreshold stimulation resulted in identical paired-pulse facilitation of the EPSP in both genotypes, in the DG (n = 7, each). (G) Input/output curves of EPSP amplitude in the CA1 region from both genotypes (n = 5, each). (H) CA1 paired-pulse interaction. The inhibition and facilitation of the population spike was similar in both genotypes in area CA1 (n = 4, each).

