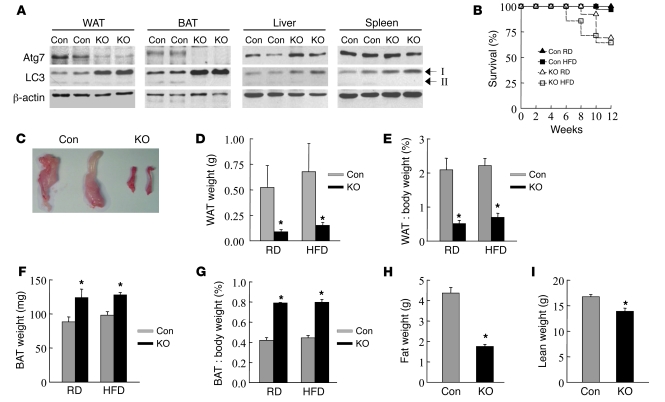
Figure 2. ATG7F/F-aP2-Cre mice have decreased WAT and increased BAT mass.
(A) Immunoblots of proteins isolated from the indicated tissues from control (Con) ATG7F/F and knockout ATG7F/F-aP2-Cre mice. The LC3-I and LC3-II forms are indicated. (B) Survival curves for RD- and HFD-fed mice (n = 13–28). (C) Representative gonadal fat pads from the 2 types of mice. (D) Gonadal WAT weights in RD- and HFD-fed mice (n = 5–14). *P < 0.001. (E) WAT weight as a percentage of total body weight (n = 4–24). *P < 0.005. (F) Interscapular BAT weights (n = 3–17). *P < 0.05. (G) BAT weight as a percentage of total body weight (n = 3–17). *P < 0.00002. (H) Total fat mass as determined by magnetic resonance spectroscopy (n = 8–20). *P < 0.00001. (I) Lean body mass in the same animals (n = 8–20). *P < 0.002. Results are mean + SEM. P values are as compared with control animals.

