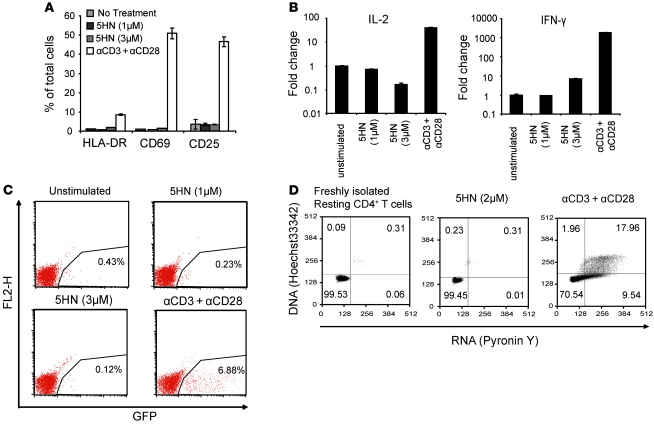
Figure 7. 5HN does not activate CD4+ T cells.
(A) Effects of 5HN on the expression of activation markers in primary resting CD4+ T cells. Freshly isolated CD4+ T cells were treated with the indicated concentrations of 5HN or with anti-CD3 plus anti-CD28 antibodies for 3 days. Expression of activation markers was quantified by flow cytometry. The values indicated the percentage of cells expressing individual markers. Data are mean ± SD of triplicate samples from 1 of 2 independent experiments. (B) Effects of 5HN on transcription of IL-2 and IFN-γ genes. Resting Bcl-2–transduced CD4+ T cells were left unstimulated or were stimulated with 5HN or anti-CD3/anti-CD28. Levels of IL-2 and IFN-γ transcripts in total cellular RNA were quantified by real-time RT-PCR and normalized to β-actin mRNA levels. The fold change relative to unstimulated samples is shown. Data are mean ± SD of triplicate samples from 1 of 2 independent experiments. (C) Effect of 5HN on the susceptibility of freshly isolated resting CD4+ T cells to HIV-1 infection. Cells were incubated with medium alone, 5HN, or anti-CD3/anti-CD28 antibodies for 3 days and were then infected with reporter virus NL4-3-ΔE-GFP. The number in each plot indicates the percentage of GFP-positive cells quantified by flow cytometry. (D) The effects of 5HN on the proliferation of latently infected cells. Cell proliferation was determined using Hoechst 33342/pyronin Y staining for DNA/RNA. The controls for the resting and activated cells are the same as in Figure 2B. The percentage of cells in each quadrant is indicated.

