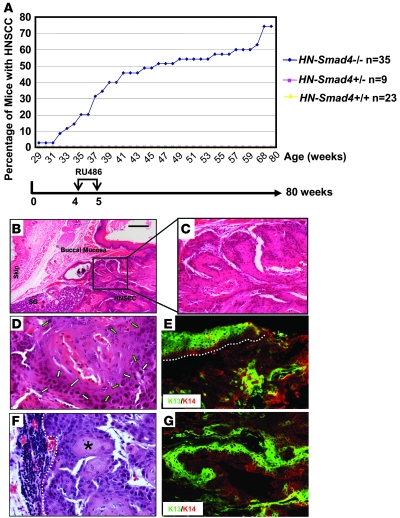
Figure 2. Spontaneous HNSCC in HN-Smad4–/– mice.
(A) Kinetics of tumor formation. Tumor formation was assessed by biweekly examination of the oral cavity in live mice and necropsy at the time of euthanasia. Data points represent the percentage of tumor-bearing mice relative to the total number of mice in each group. (B) An H&E-stained tumor section of a buccal SCC in an HN-Smad4–/– mouse demonstrates that HNSCCs were derived from the buccal mucosa and not the skin of HN-Smad4–/– mice. SG, salivary gland adjacent to the HNSCC. (C) A dysplastic region in the HNSCC from B. (D) High magnification shows SCC cells with enlarged nuclei (green arrows) and increased mitosis (white arrows), indicative of malignant pathology. (E) Staining of K13 (green), which stains stratified epithelia, counterstained with the general keratinocyte marker K14 (red) in a buccal SCC from an HN-Smad4–/– mouse indicates tumors are derived from buccal mucosa. The white dotted line highlights the adjacent mucosa. (F) H&E tumor section of a lymph node metastasis in an HN-Smad4–/– mouse. The white dotted line delineates the boundary between metastatic tumor cells and lymph node tissue. The asterisk indicates a keratin pearl. (G) Staining of K13 (green), counterstained with K14 (red) in a lymph node metastasis from an HN-Smad4–/– mouse indicates the tumor is derived from an HNSCC. Scale bar: 100 μm (B); 40 μm (C, E, and G); 20 μm (D and F).

