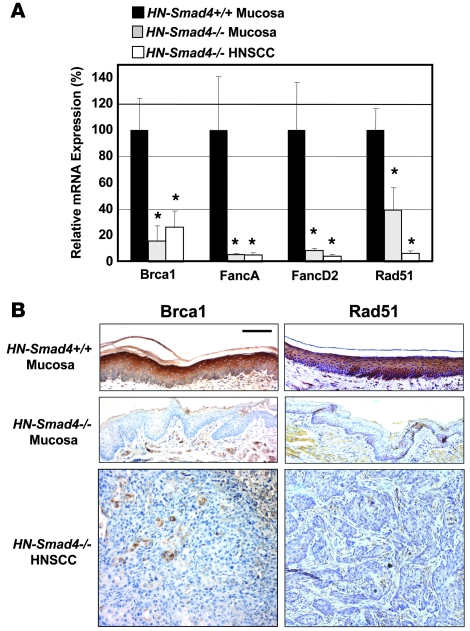
Figure 3. Downregulation of Fanc/Brca transcripts in HN-Smad4–/– mucosa and HNSCC.
(A) Decreased relative mRNA expression of Brca1, FancA, FancD2, and Rad51 in HN-Smad4–/– mucosa and HNSCC, compared with HN-Smad4+/+ mucosa by qRT-PCR. Means of 5–10 samples from each group are presented, and error bars indicate SEM. The average expression of Smad4 in the HN-Smad4+/+ samples was arbitrarily set at 100%. *P < 0.05 versus HN-Smad4+/+ mucosa. (B) Decreased Brca1 and Rad51 protein by IHC in HN-Smad4–/– mucosa and HNSCC compared with HN-Smad4+/+ mucosa. Five to 10 samples per group were analyzed, and a representative image is presented. Scale bar: 40 μm (all panels).

