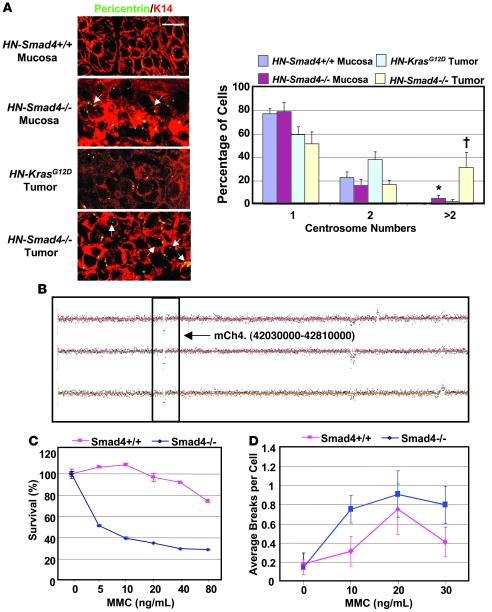
Figure 4. Abnormal centrosomes, increased genomic aberrations, and increased MMC sensitivity in HN-Smad4–/– mucosa and HNSCC.
(A) Immunofluorescence for pericentrin (green or yellow). HN-Smad4–/– mucosa and HNSCCs have increased abnormal centrosome numbers compared with HN-Smad4+/+ mucosa and control HN-Smad4+/+ tumors (HN-K-rasG12D papillomas), respectively. K14 (red) was used to counterstain epithelial cells. 3–5 samples per group were analyzed, and a representative image is presented. Arrows highlight cells with at least 3 centrosomes. The histogram summarizes quantification of centrosome numbers. 100–200 cells per group were analyzed. Error bars indicate SEM. †P < 0.05 versus HN-Smad4+/+ tumors; *P < 0.05 versus HN-Smad4+/+ mucosa. Scale bar: 10 μm (all panels). (B) Chromosome 4 aCGH of 3 HN-Smad4–/– HNSCCs indicates that HN-Smad4–/– HNSCCs have several consistent genomic aberrations. The boxed region represents 2 copies of loss at chromosome 4qA5. (C) MMC sensitivity assay. Percent cell viability at increasing MMC concentrations indicates that Smad4–/– cells were significantly more sensitive to MMC than Smad4+/+ cells. The experiment was run in triplicate, and error bars indicate SEM. P < 0.05 for all data points, other than 0 ng/ml, versus Smad4+/+ cells. (D) Chromosome breakage assay. Plot of average chromosome breaks per cell for Smad4+/+ and Smad4–/– cells at increasing MMC concentrations indicates that Smad4–/– cells have increased chromosome breaks compared with Smad4+/+ cells. The experiments were run in triplicate, and error bars indicate SEM. P < 0.001 for all data points, other than 0 ng/ml, versus Smad4+/+ cells.

