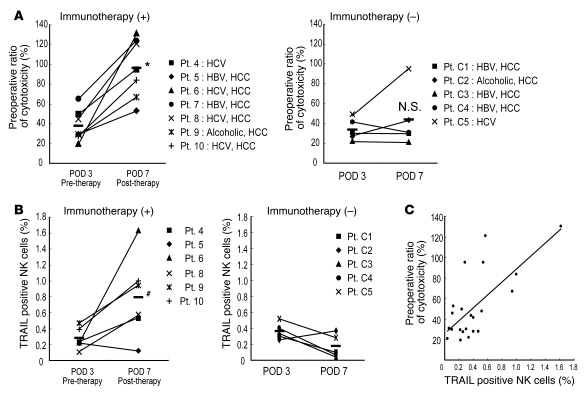
Figure 2. Adoptive immunotherapy with IL-2/OKT3–treated liver lymphocytes promoted the cytotoxic activity and TRAIL expression of NK cells in LT recipients.
(A) The NK cytotoxic activities of the indicated effectors against their target cells were analyzed by the 51Cr-release assay. The dot plot represents the NK cytotoxic activities of freshly isolated peripheral blood lymphocytes obtained from recipients who received immunotherapy (+) ( n = 7) and did not receive immunotherapy (–) (n = 5) against HepG2 target cells (effector/target [E/T] ratio, 40:1) 3 and 7 days after LT. NK cytotoxic activities are represented as a proportion (percentage) of the preoperative cytotoxicity in each patient. Horizontal lines indicate the mean. Statistical analyses were performed using the 2-tailed, paired Student’s t test. *P < 0.05 for day 7 versus day 3. (B) The frequency of TRAIL+ NK cells increased remarkably in the peripheral blood of LT recipients who received the immunotherapy. Horizontal lines indicate the mean. Statistical analyses were performed using the Mann-Whitney U test. #P = 0.013 for immunotherapy group versus untreated group in postoperative day 7. (C) Correlation between TRAIL+ NK cell ratio and NK cytolytic activity after LT (Spearman rank-order correlation coefficient = 0.54, P = 0.01). Statistical analyses were performed using the Spearman rank-order correlation coefficient. The diagonal line indicates a linear regression line. Each dot indicates the cytotoxicity and TRAIL+ NK cell percentange of each patient. C1, control 1; POD, postoperative day; Pt., patient.

