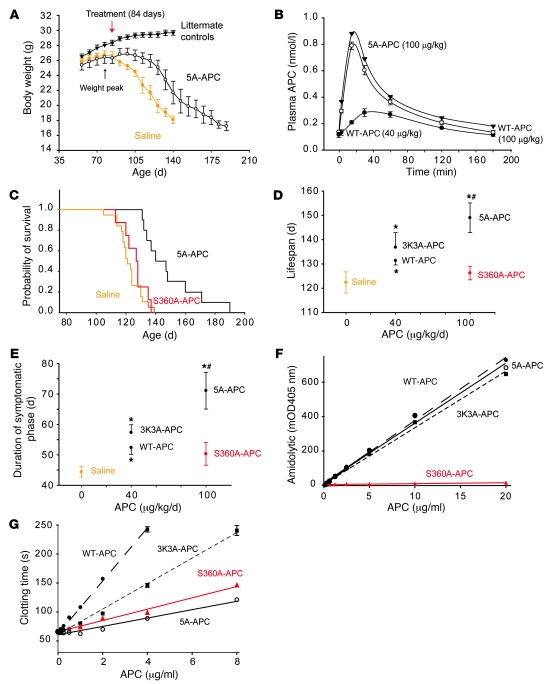
Figure 1. APC analogs delivered after disease onset control disease progression in SOD1G93A mice.
(A) Weight curves of SOD1G93A mice treated with saline (n = 19) or 5A-APC (100 μg/kg/d i.p.; n = 10) after disease onset (84 days; red arrow) and in nontransgenic littermate controls (n = 12). *P < 0.05, 5A-APC versus saline treatment, repeated-measures ANOVA. (B) APC arterial plasma profiles after i.p. administration of WT-APC (40 μg/kg/d, filled circles; 100 μg/kg/d, open circles) or 5A-APC (100 μg/kg/d, triangles) determined by ELISA. n = 3. (C) Cumulative probability of survival in SOD1G93A mice treated with saline (n = 19), S360A-APC (100 μg/kg/d i.p.; n = 10) or 5A-APC (100 μg/kg/d; n = 10). (D and E) Lifespan (D) and duration of symptomatic phase (E) in SOD1G93A mice treated i.p. with saline (n = 19), WT-APC (40 μg/kg/d; n = 10), 3K3A-APC (40 μg/kg/d; n = 11), or S360A-APC or 5A-APC (as in C). Differences were calculated from the survival curves by the Cox proportional hazard method (D) and by 1-way ANOVA followed by Tukey post-hoc test (E). *P < 0.05 versus saline; #P < 0.05 versus S360A-APC. S360A-APC was not significantly different from saline. (F and G) Amidolytic activity of (F) and clotting time for (G) WT-APC (filled circles), 3K3A-APC (filled squares), 5A-APC (open circles), and S360A-APC (triangles).

