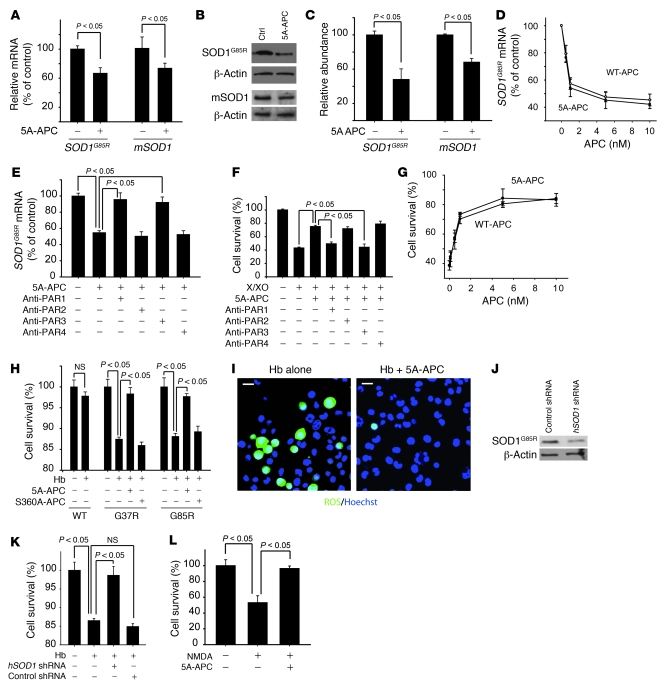
Figure 4. 5A-APC–PAR1/PAR3–mediated SOD1 suppression and neuroprotection in N2a cells.
(A) SOD1G93A and mSOD1 mRNA levels, determined by QPCR in N2a-SOD1G85R cells treated with 5A-APC (5 nM) or saline for 48 h. (B) SOD1G93A and mSOD1 protein levels, determined by immunoblot analysis of N2a-SOD1G85R cell lysates in A. (C) Scanning densitometry of SOD1G93A and mSOD1 bands in B, relative to β-actin. (D and E) SOD1G93A mRNA levels in N2a-SOD1G85R cells treated with 0–10 nM WT-APC or 5A-APC for 48 h (D) or 5 nM 5A-APC with and without 20 μg/ml of cleavage site–blocking PAR1, PAR2, PAR3, and PAR4 antibodies (E). (F and G) N2a-SOD1G85R cell viability 16 h after incubation with xanthine/xanthine oxidase (X/XO) with and without 5 nM 5A-APC and 20 μg/ml PAR-blocking antibodies (F) and 0–10 nM WT-APC or 5A-APC (G). (A–G) n = 5. (H) Viability of N2a-SOD1WT, N2a-SOD1G37R, and N2a-SOD1G85R cells 16 h after incubation with Hb with and without 5 nM 5A-APC or S360A-APC. (I) Double staining for ROS and Hoechst in N2a-SOD1G85R cells 16 h after incubation with Hb with and without 5 nM 5A-APC or S360A-APC. Scale bars: 20 μm. (J) SOD1 reduction in hSOD1 shRNA–transfected N2a-SOD1G85R cells by immunoblot analysis. (K) Viability of N2a-SOD1G85R cells transfected with hSOD1 shRNA or control shRNA and incubated with Hb as in H. (H–K) n = 3–5. (L) N2a-SOD1G85R cell viability 24 hours after 10 minutes of exposure to 300 μM NMDA with or without 5 nM 5A-APC. n = 5.

