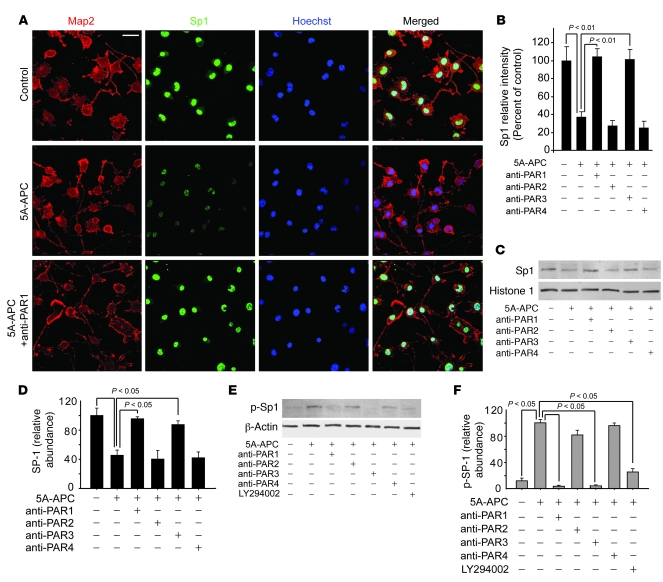
Figure 5. The 5A-APC–PAR1/PAR3 pathway blocks nuclear translocation of Sp1 in N2a-SOD1G85R–expressing cells.
(A and B) Confocal microscopy images (A) and signal intensity (B) of Map2 (red), Sp1 (green), and Hoechst nuclear staining (blue) in N2a-SOD1G85R cells treated with 1 nM 5A-APC for 48 hours with and without PAR1, PAR2, PAR3, and PAR4 cleavage site–blocking antibodies. Scale bar: 20 μm. n = 5. (C and D) Immunoblot analysis (C) and densitometry relative to histone 1 (D) of Sp1 in nuclear lysates of N2a-SOD1G85R cells treated as in B. n = 3–5. (E and F) Immunoblot analysis (E) and scanning densitometry relative to β-actin (F) of phosphorylated Sp1 in cytoplasmic lysates of N2a-SOD1G85R cells treated as in B or with 50 μM of the PI3K inhibitor LY294002. n = 3–5.

