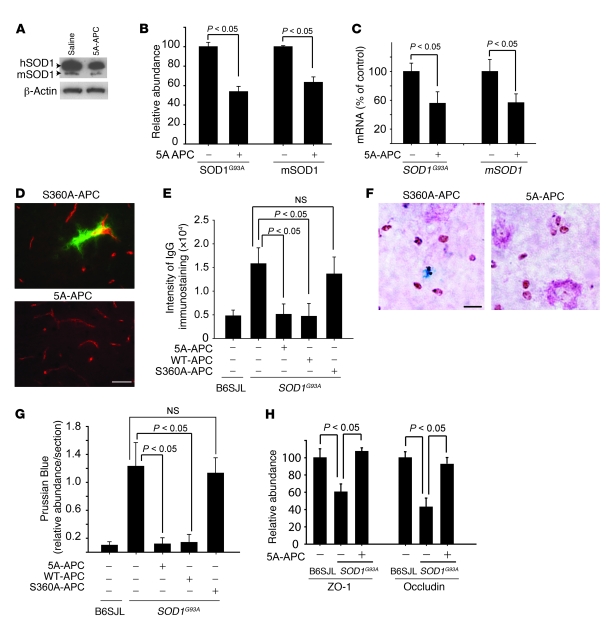
Figure 6. APC downregulates SOD1 in spinal cord microvessels and blocks BSCB disruption in SOD1G93A mice.
(A and B) Immunoblotting (A) and densitometry (B) of human SOD1G93A and mouse mSOD1 in spinal cord microvessels isolated from SOD1G93A mice treated with 5A-APC or S360A-APC at 100 μg/kg/d i.p. for 4 weeks after disease onset. Relative band density was normalized to β-actin. n = 5 per group. (C) SOD1G93A and mSOD1 mRNA levels determined by QPCR in laser-captured microvessels from mice as in B. n = 5 per group. (D) Immunostaining for IgG (green) and endothelium (CD31, red) in the lumbar spinal cords of SOD1G93A mice treated with S360A-APC or 5A-APC as in B. Scale bar: 50 μm. (E) IgG signal intensity in the lumbar spinal cords of SOD1G93A mice treated as in B or with 40 μg/kg/d WT-APC. n = 5–8. (F) Hemosiderin deposits in the lumbar spinal cord of SOD1G93A mice treated as in B. Scale bar: 20 μm. (G) Quantification of lumbar spinal cord hemosiderin deposits in SOD1G93A mice from D and F. n = 5–8. (H) Relative abundance of ZO-1 and occludin, normalized to β-actin, from immunoblots of spinal cord microvessels isolated from SOD1G93A mice treated with 5A-APC as in B or with saline. n = 3–5. (E, G, and H) B6SJL denotes littermate controls.

