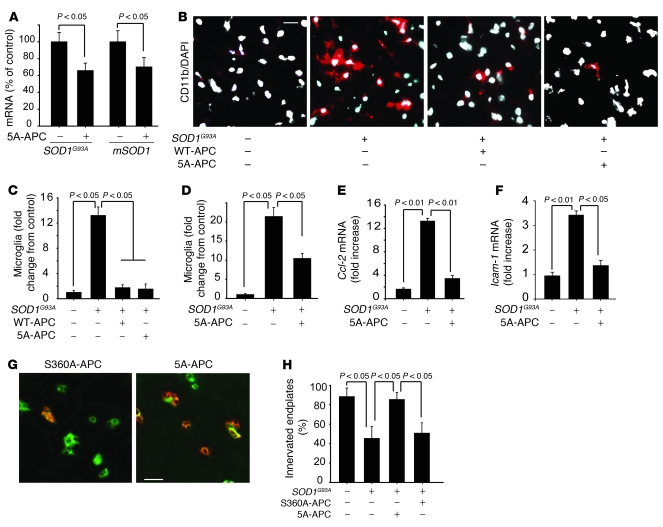
Figure 8. APC downregulates SOD1 in microglia and controls neuroinflammatory response in SOD1G93A mice.
(A) QPCR analysis of SOD1G93A and mSOD1 mRNA levels in laser-captured microglia in SOD1G93A mice treated with 5A-APC or S360A-APC at 100 μg/kg/d for 7 weeks after disease onset. n = 5. (B) Immunostaining of activated microglia (CD11b, red) in SOD1G93A mice treated with saline, 40 μg/kg/d WT-APC, or 100 μg/kg/d 5A-APC for 4 weeks after disease onset. Nuclei were stained with DAPI (white). Scale bar: 20 μm. (C) Microglia numbers, in SOD1G93A mice treated as in B, relative to control B6SJL mice (arbitrarily taken as 1). n = 5–6 per group. (D) CD11b-positive microglia numbers in SOD1G93A mice treated with 100 μg/kg/d 5A-APC or S360A-APC for 7 weeks. n = 5 per group. (E and F) QPCR analysis of mRNA transcripts for Ccl-2 (E) and Icam-1 (F) in the lumbar spinal cords of mice treated with saline or 100 μg/kg/d 5A-APC for 4 weeks. n = 3–5 per group. (G) Double immunostaining of skeletal muscle sections with α-bungarotoxin and VAChT, to label endplates and axon terminals, respectively, in SOD1G93A mice treated with 100 μg/kg/d 5A-APC or S360A-APC for 4 weeks after disease onset. Denervated endplates were labeled only with bungarotoxin (green; left). Innervated endplates were labeled with both bungarotoxin and VAChT (right). Scale bar: 25 μm. (H) Percentage of innervated plates in G. n = 4 per group.

