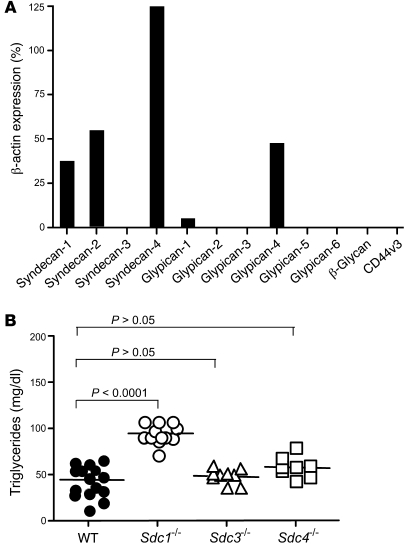
Figure 1. RT-PCR analysis of membrane HSPGs and hypertriglyceridemia in Sdc1–/– mice.
(A) Transcript levels of the membrane proteoglycan core proteins were measured in isolated hepatocytes. The numbers represent the level of expression compared with the housekeeping gene β-actin, using CT values from triplicate assays according to the Stratagene manual. Error bars are not shown because they are factored into the final calculation. Comparable results were obtained in 2 independent preparations of RNA. (B) Triglycerides were measured in plasma samples from fasted male and female mice of indicated genotypes. Wild-type (n = 14), Sdc1–/– (n = 13), Sdc3–/– (n = 10), Sdc4–/– (n = 8). Horizontal bars indicate mean values.

