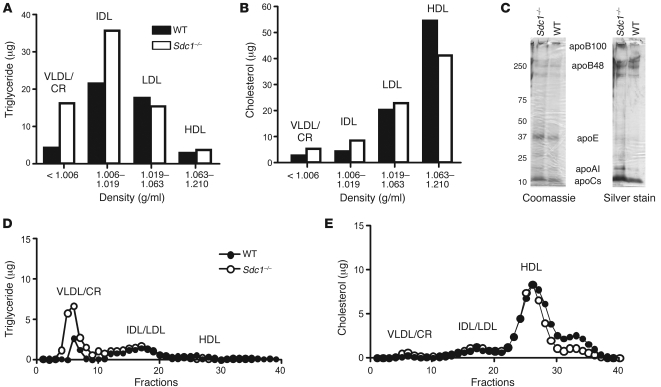
Figure 2. Hypertriglyceridemia in Sdc1–/– mice.
(A and B) Triglyceride (A) and cholesterol (B) levels were measured in lipoprotein subclasses separated by preparative density ultracentrifugation. Each value is from pooled plasma derived from 10 mice. (C) Samples of purified lipoproteins (δ < 1.006 g/ml) were analyzed by gradient SDS-PAGE, and the individual apolipoproteins were visualized by Coomassie blue or silver staining. (D and E) Plasma triglycerides (D) and cholesterol (E) were analyzed by FPLC.

