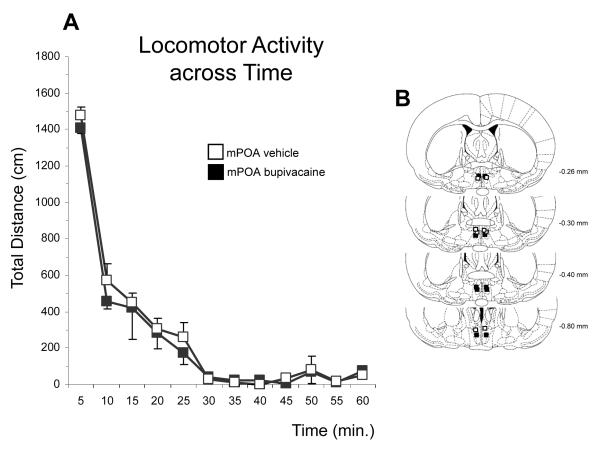
Figure 5.
A. Locomotor activity (mean ± SEM) graphed in 5-min intervals over a 60min-test session for postpartum females with bilateral infusions of either 2% bupivacaine or vehicle into the mPOA. B. Schematic representation, based on the microscopic analysis of cresyl violet-stained sections, of infusion sites for female rats tested for locomotor activity. Plates were taken from the atlas of Paxinos and Watson (1997). Numbers beside each plate indicate the distance from bregma in millimeters.

