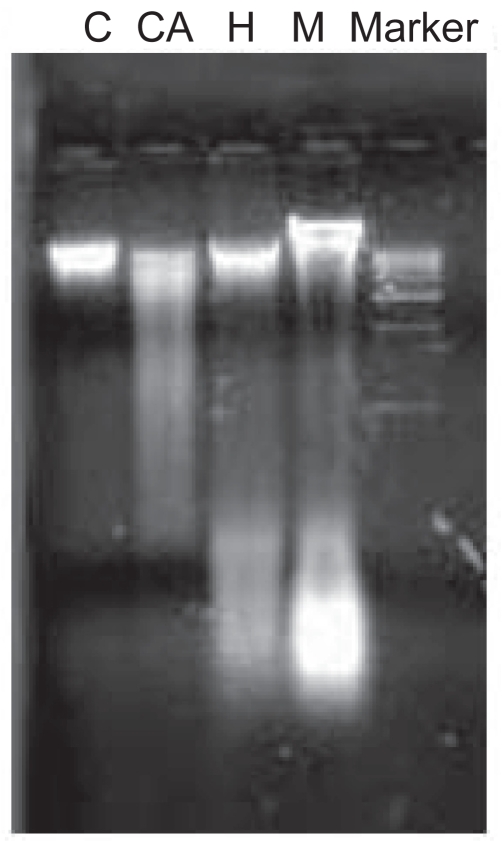
Figure 6.
DNA fragmentation assay. 1st panel (C) from left is indicating the DNA from the control live cells. A distinct DNA band can be observed here. In the 2nd panel (CA) fragmented sheared DNA (mainly in lower molecular weight region) was observed in case of modified medium. Similarly in the third and fourth panel (H and M) for hydrogen peroxide and metronidazole respectively, DNA fragmentation can be observed. The DNA marker ranges from 1–10 kb.

